Burger King 2010 Annual Report Download - page 58
Download and view the complete annual report
Please find page 58 of the 2010 Burger King annual report below. You can navigate through the pages in the report by either clicking on the pages listed below, or by using the keyword search tool below to find specific information within the annual report.-
 1
1 -
2
-
3
-
4
-
5
-
6
-
7
-
8
-
9
-
10
-
11
-
12
-
13
-
14
-
15
-
16
-
17
-
18
-
19
-
20
-
21
-
22
-
23
-
24
-
25
-
26
-
27
-
28
-
29
-
30
-
31
-
32
-
33
-
34
-
35
-
36
-
37
-
38
-
39
-
40
-
41
-
42
-
43
-
44
-
45
-
46
-
47
-
 48
48 -
 49
49 -
 50
50 -
 51
51 -
 52
52 -
 53
53 -
 54
54 -
 55
55 -
 56
56 -
 57
57 -
 58
58 -
 59
59 -
 60
60 -
 61
61 -
 62
62 -
 63
63 -
 64
64 -
 65
65 -
 66
66 -
 67
67 -
 68
68 -
69
-
70
-
71
-
72
-
73
-
74
-
75
-
76
-
77
-
78
-
79
-
80
-
81
-
82
-
83
-
84
-
85
-
86
-
87
-
88
-
89
-
90
-
91
-
92
-
93
-
94
-
95
-
96
-
97
-
98
-
99
-
100
-
101
-
102
-
103
-
104
-
105
-
106
-
107
-
108
-
109
-
110
-
111
-
112
-
113
-
114
-
115
-
116
-
117
-
118
-
119
-
120
-
121
-
122
-
123
-
124
-
125
-
126
-
127
-
128
-
129
-
130
-
131
-
132
-
133
-
134
-
135
-
136
-
137
-
138
-
139
-
140
-
141
-
142
-
143
-
144
-
145
-
146
 |
 |

Table of Contents
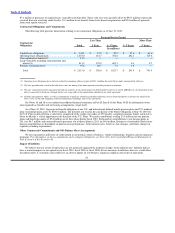
In EMEA/APAC, property revenues decreased by $7.5 million, or 23%, to $25.4 million for the fiscal year ended June 30, 2009,
compared to the prior year, primarily due to a $5.2 million unfavorable impact from the movement of currency exchange rates and the
reduction in the number of properties in our portfolio. These factors were partially offset by increased revenues from percentage rents as
a result of positive franchise comparable sales growth.
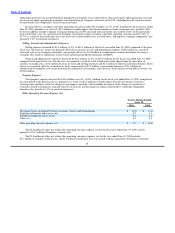
Operating Costs and Expenses
Food, Paper and Product Costs
Total food, paper and product costs increased by $39.4 million, or 7%, to $603.7 million for the fiscal year ended June 30, 2009,
primarily as a result of the net addition of 69 Company restaurants during the twelve months ended June 30, 2009, and significant
increases in commodity costs, including the negative currency exchange impact of cross border purchases which occurs in Canada,
Mexico and the U.K. when our suppliers purchase goods in currency other than the local currency in which they operate and pass on all,
or a portion of the currency exchange impact to us. These factors were partially offset by a $26.1 million favorable impact from the
movement of currency exchange rates. As a percentage of Company restaurant revenues, food, paper and product costs increased by
0.7% to 32.1%, primarily due to the increase in commodity costs noted above, partially offset by the impact of strategic pricing
initiatives.
In the United States and Canada, food, paper and product costs increased by $58.8 million, or 15%, to $440.0 million for the fiscal
year ended June 30, 2009, primarily as a result of the net addition of 59 Company restaurants during fiscal 2009, as well as significant
increases in commodity costs, including the negative currency exchange impact of cross border purchases in Canada, partially offset by
a $7.4 million favorable impact from the movement of currency exchange rates. Food, paper and product costs as a percentage of
Company restaurant revenues increased 0.5% to 33.0%, primarily due to an increase in the cost of beef, cheese, chicken and other food
costs, including the currency exchange impact of cross border purchases in Canada, partially offset by the impact of strategic pricing
initiatives.
The cost of many of our core commodities reached historical highs in the United States and Canada during the first quarter of
fiscal 2009; however, commodity and other food costs moderated throughout the remainder of fiscal 2009.
In EMEA/APAC, food, paper and product costs decreased by $17.6 million, or 11%, to $140.6 million for the fiscal year ended
June 30, 2009, primarily as a result of the favorable impact from the movement of currency exchange rates of $14.7 million and the
refranchising of Company restaurants in the prior year, primarily in Germany and the U.K., partially offset by an increase in commodity
costs, including the negative currency exchange impact of cross border purchases. Food, paper and product costs as a percentage of
Company restaurant revenues increased 0.3% to 28.8%, primarily due to a significant increase in commodity costs, partially offset by
the impact of strategic pricing initiatives.
In Latin America, food, paper and product costs decreased by $1.8 million, or 7%, to $23.1 million for the fiscal year ended
June 30, 2009, compared to the same period in the prior year, as a result of the benefits derived from the favorable impact from the
movement of currency exchange rates of $4.0 million, offset by the net addition of eight Company restaurants during fiscal 2009 and an
increase in commodity costs, including the negative currency exchange impact of cross border purchases in Mexico and the indexing of
local purchases to the U.S. dollar. Food, paper and product costs as a percentage of Company restaurant revenues increased by 1.7% to
38.4% primarily due to the increase in commodity costs as noted above, partially offset by the impact of strategic pricing initiatives.
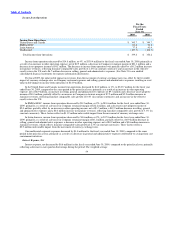
Payroll and Employee Benefits Costs
Total payroll and employee benefits costs increased by $47.5 million, or 9%, to $582.2 million for the fiscal year ended June 30,
2009, primarily due to the net addition of 69 Company restaurants during fiscal 2009, as well as increased labor costs in the United
States and Canada and EMEA, partially offset by a $24.0 million favorable impact from the movement of currency exchange rates. As a
percentage of Company restaurant revenues, payroll
56