Burger King 2010 Annual Report Download - page 61
Download and view the complete annual report
Please find page 61 of the 2010 Burger King annual report below. You can navigate through the pages in the report by either clicking on the pages listed below, or by using the keyword search tool below to find specific information within the annual report.-
 1
1 -
2
-
3
-
4
-
5
-
6
-
7
-
8
-
9
-
10
-
11
-
12
-
13
-
14
-
15
-
16
-
17
-
18
-
19
-
20
-
21
-
22
-
23
-
24
-
25
-
26
-
27
-
28
-
29
-
30
-
31
-
32
-
33
-
34
-
35
-
36
-
37
-
38
-
39
-
40
-
41
-
42
-
43
-
44
-
45
-
46
-
47
-
48
-
49
-
50
-
 51
51 -
 52
52 -
 53
53 -
 54
54 -
 55
55 -
 56
56 -
 57
57 -
 58
58 -
 59
59 -
 60
60 -
 61
61 -
 62
62 -
 63
63 -
 64
64 -
 65
65 -
 66
66 -
 67
67 -
 68
68 -
 69
69 -
 70
70 -
 71
71 -
72
-
73
-
74
-
75
-
76
-
77
-
78
-
79
-
80
-
81
-
82
-
83
-
84
-
85
-
86
-
87
-
88
-
89
-
90
-
91
-
92
-
93
-
94
-
95
-
96
-
97
-
98
-
99
-
100
-
101
-
102
-
103
-
104
-
105
-
106
-
107
-
108
-
109
-
110
-
111
-
112
-
113
-
114
-
115
-
116
-
117
-
118
-
119
-
120
-
121
-
122
-
123
-
124
-
125
-
126
-
127
-
128
-
129
-
130
-
131
-
132
-
133
-
134
-
135
-
136
-
137
-
138
-
139
-
140
-
141
-
142
-
143
-
144
-
145
-
146
 |
 |

Table of Contents
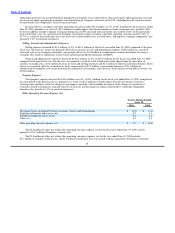
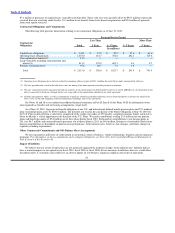
Income from Operations
For the
Fiscal Years
Ended
June 30,
2009 2008
Income from Operations:
United States and Canada $ 345.7 $ 349.7
EMEA/APAC 83.6 91.8
Latin America 37.8 41.4
Unallocated (127.7) (128.7)
Total Income from Operations $ 339.4 $ 354.2
Income from operations decreased by $14.8 million, or 4%, to $339.4 million for the fiscal year ended June 30, 2009, primarily as
a result of an increase in other operating expense, net of $2.5 million, a decrease in Company restaurant margin of $21.1 million and a
decrease in net property income of $4.1 million. The decrease in income from operations was partially offset by a $6.2 million increase
in franchise revenues, reflecting franchise comparable sales growth of 1.4% (in constant currencies) and an increase in the effective
royalty rate in the U.S and a $6.7 million decrease in selling, general and administrative expenses. (See Note 23 to our audited
consolidated financial statements for segment information disclosures).
For fiscal 2009, the unfavorable impact on revenues from the movement of currency exchange rates was offset by the favorable
impact of currency exchange rates on Company restaurant expenses and selling, general and administrative expenses, resulting in a net
unfavorable impact on income from operations of $14.9 million.
In the United States and Canada, income from operations decreased by $4.0 million, or 1%, to $345.7 million for the fiscal year
ended June 30, 2009, compared to the same period in the prior fiscal year, primarily as a result of an increase in other operating
expense, net of $6.9 million, an increase in selling, general and administrative expenses of $9.7 million and a decrease in net property
income of $0.4 million, partially offset by an increase in Company restaurant margin of $7.2 million and $5.2 million increase in
franchise revenues, reflecting franchise comparable sales growth of 0.4% (in constant currencies) and an increase in the effective
royalty rate in the U.S.
In EMEA/APAC, income from operations decreased by $8.2 million, or 9%, to $83.6 million for the fiscal year ended June 30,
2009, primarily as a result of a decrease in Company restaurant margin of $22.2 million, and a decrease in net property income of
$2.0 million, partially offset by an increase in other operating income, net of $3.5 million, a $12.2 million decrease in selling, general
and administrative expenses and a $0.4 million increase in franchise revenues, reflecting franchise comparable sales growth of 3.3% (in
constant currencies). These factors reflect an $11.9 million unfavorable impact from the movement of currency exchange rates.
In Latin America, income from operations decreased by $3.6 million, or 9%, to $37.8 million for the fiscal year ended June 30,
2009, primarily as a result of a decrease in Company restaurant margin of $6.1 million, partially offset by a $0.9 million decrease in
selling, general and administrative expenses, a decrease in other operating expense, net of $0.9 million and a $0.6 million increase in
franchise revenues, which reflects franchise comparable sales growth of 2.3% (in constant currencies). These factors reflect a
$2.9 million unfavorable impact from the movement of currency exchange rates.
Our unallocated corporate expenses decreased by $1.0 million for the fiscal year ended June 30, 2009, compared to the same
period in the prior fiscal year, primarily as a result of a decrease in general and administrative expenses attributable to savings from cost
containment initiatives.
Interest Expense, Net
Interest expense, net decreased by $6.6 million for the fiscal year ended June 30, 2009, compared to the prior fiscal year, primarily
reflecting a decrease in rates paid on borrowings during the period. The weighted average
59