Burger King 2010 Annual Report Download - page 47
Download and view the complete annual report
Please find page 47 of the 2010 Burger King annual report below. You can navigate through the pages in the report by either clicking on the pages listed below, or by using the keyword search tool below to find specific information within the annual report.-
 1
1 -
2
-
3
-
4
-
5
-
6
-
7
-
8
-
9
-
10
-
11
-
12
-
13
-
14
-
15
-
16
-
17
-
18
-
19
-
20
-
21
-
22
-
23
-
24
-
25
-
26
-
27
-
28
-
29
-
30
-
31
-
32
-
33
-
34
-
35
-
36
-
 37
37 -
 38
38 -
 39
39 -
 40
40 -
 41
41 -
 42
42 -
 43
43 -
 44
44 -
 45
45 -
 46
46 -
 47
47 -
 48
48 -
 49
49 -
 50
50 -
 51
51 -
 52
52 -
 53
53 -
 54
54 -
 55
55 -
 56
56 -
 57
57 -
58
-
59
-
60
-
61
-
62
-
63
-
64
-
65
-
66
-
67
-
68
-
69
-
70
-
71
-
72
-
73
-
74
-
75
-
76
-
77
-
78
-
79
-
80
-
81
-
82
-
83
-
84
-
85
-
86
-
87
-
88
-
89
-
90
-
91
-
92
-
93
-
94
-
95
-
96
-
97
-
98
-
99
-
100
-
101
-
102
-
103
-
104
-
105
-
106
-
107
-
108
-
109
-
110
-
111
-
112
-
113
-
114
-
115
-
116
-
117
-
118
-
119
-
120
-
121
-
122
-
123
-
124
-
125
-
126
-
127
-
128
-
129
-
130
-
131
-
132
-
133
-
134
-
135
-
136
-
137
-
138
-
139
-
140
-
141
-
142
-
143
-
144
-
145
-
146
 |
 |

Table of Contents
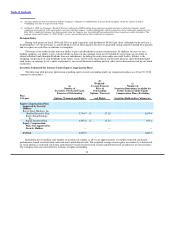
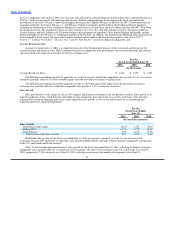
Comparable Sales Growth
Comparable sales growth refers to the change in restaurant sales in one period from a comparable period in the prior year for
restaurants that have been open for 13 months or longer as of the end of the most recent period. Company comparable sales growth
refers to comparable sales growth for Company restaurants and franchise comparable sales growth refers to comparable sales growth for
franchise restaurants. We believe comparable sales growth is a key indicator of our performance, as influenced by our strategic
initiatives and those of our competitors.
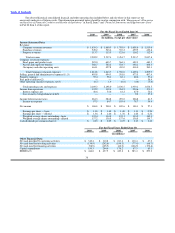
For the
Fiscal Years Ended
June 30,
2010 2009 2008
(In constant currencies)
Company Comparable Sales Growth:
United States & Canada (2.4)% 0.5% 2.6%
EMEA/APAC (2.1)% 0.1% 3.8%
Latin America (4.1)% (3.2)% 1.8%
Total Company Comparable Sales Growth (2.4)% 0.3% 2.9%
Franchise Comparable Sales Growth:
United States & Canada (4.1)% 0.4% 5.8%
EMEA/APAC 1.2% 3.3% 5.6%
Latin America (1.1)% 2.3% 4.5%
Total Franchise Comparable Sales Growth (2.3)% 1.4% 5.7%
System−wide Comparable Sales Growth:
U.S. & Canada (3.9)% 0.4% 5.4%
EMEA/APAC 0.8% 2.9% 5.4%
Latin America (1.3)% 1.9% 4.3%
Total System−wide Comparable Sales Growth (2.3)% 1.2% 5.4%
Negative worldwide comparable sales growth of 2.3% (in constant currencies) for the fiscal year ended June 30, 2010, was
primarily driven by negative comparable sales growth in the U.S. and Canada segment, resulting from continued macroeconomic
weakness, including high levels of unemployment and underemployment, and lower average check as consumer purchases shifted
toward value menu options and value promotions in the U.S., such as the 1/4 lb. Double Cheeseburger, Buck Double and $1
BK Breakfast Muffin Sandwich promotions. These factors were partially offset by increased traffic and the successful introduction of
higher−priced premium products, such as the Steakhouse XT burger line, BK Fire−Grilled Ribs limited−time offer and BK tm Breakfast
Bowl. In addition, worldwide comparable sales growth for the fiscal year was adversely affected by negative comparable sales growth
in the Latin America segment and adverse weather conditions in the U.S., U.K. and Germany, which severely impacted sales and traffic
during the months of January and February. Negative comparable sales growth in the U.S. and Canada and Latin America segments was
partially offset by positive comparable sales growth in EMEA/APAC, primarily driven by positive comparable sales growth in Spain,
the UK, Turkey, Australia and New Zealand, partially offset by negative comparable sales growth in Germany.
Negative comparable sales growth in the U.S. and Canada of 3.9% (in constant currencies) for the fiscal year ended June 30, 2010,
continued to be negatively impacted by high levels of unemployment and weak consumer confidence. As a result, we experienced lower
average check as consumers shifted purchases to value menu options and value promotions in the U.S., partially offset by positive
traffic in the U.S., primarily due to the 1/4 lb. Double Cheeseburger and Buck Double promotions. Adverse weather conditions in the
U.S. also severely impacted sales during the months of January and February. During the period, we featured two multifaceted
promotions with The Twilight Saga: New Moon and The Twilight Saga: Eclipse, which focused on broadening our brand’s appeal with
female SuperFans, value−focused promotions, such as the $1 Whopper Jr.® sandwich, 2 for $4 Original Chicken sandwiches,
Whopper® sandwich limited time offers and the roll−out of the premium Steakhouse XTtm burger line, as well as SuperFamily
promotions including SpongeBob SquarePantstm, Planet 51tm , G.I. Joetm, Cloudy with a
45