Burger King 2010 Annual Report Download - page 49
Download and view the complete annual report
Please find page 49 of the 2010 Burger King annual report below. You can navigate through the pages in the report by either clicking on the pages listed below, or by using the keyword search tool below to find specific information within the annual report.-
 1
1 -
2
-
3
-
4
-
5
-
6
-
7
-
8
-
9
-
10
-
11
-
12
-
13
-
14
-
15
-
16
-
17
-
18
-
19
-
20
-
21
-
22
-
23
-
24
-
25
-
26
-
27
-
28
-
29
-
30
-
31
-
32
-
33
-
34
-
35
-
36
-
37
-
38
-
 39
39 -
 40
40 -
 41
41 -
 42
42 -
 43
43 -
 44
44 -
 45
45 -
 46
46 -
 47
47 -
 48
48 -
 49
49 -
 50
50 -
 51
51 -
 52
52 -
 53
53 -
 54
54 -
 55
55 -
 56
56 -
 57
57 -
 58
58 -
 59
59 -
60
-
61
-
62
-
63
-
64
-
65
-
66
-
67
-
68
-
69
-
70
-
71
-
72
-
73
-
74
-
75
-
76
-
77
-
78
-
79
-
80
-
81
-
82
-
83
-
84
-
85
-
86
-
87
-
88
-
89
-
90
-
91
-
92
-
93
-
94
-
95
-
96
-
97
-
98
-
99
-
100
-
101
-
102
-
103
-
104
-
105
-
106
-
107
-
108
-
109
-
110
-
111
-
112
-
113
-
114
-
115
-
116
-
117
-
118
-
119
-
120
-
121
-
122
-
123
-
124
-
125
-
126
-
127
-
128
-
129
-
130
-
131
-
132
-
133
-
134
-
135
-
136
-
137
-
138
-
139
-
140
-
141
-
142
-
143
-
144
-
145
-
146
 |
 |

Table of Contents
the U.S. Comparable sales in fiscal 2009 were also adversely affected by softer performance in Puerto Rico due to the introduction of a
VAT tax, which has negatively affected disposable income. Products and promotions featured during the fiscal year include the
introduction of the Angry Whopper sandwich throughout the region, the Chipotle Whopper in Mexico, the BK ® Stacker promotion in
Argentina and Chile, the Crown Whopper Jr. and Whopper Jackpot sweepstakes in Puerto Rico, the Steakhouse Burger platform,
including the Mushroom & Swiss Steakhouse Burger in Central America, Puerto Rico and the Caribbean and the new BK ® Fish Wrap
for the Lenten season. We continued to focus on value with the Come Como Rey (Eat Like a King) everyday value menu in Mexico,
Central America and the Caribbean, the XL double burger value promotion in Argentina, Chile and the Dominican Republic and the
double and triple Crown Whopper Jr. sandwich promotion in Puerto Rico. In addition, our regional Latin Billboard music promotion in
selected markets in the region, the successful breakfast relaunch in Puerto Rico and strong kids properties such as Star Trek tm,
Pokémontm, Cabbage Patch Kidstm, Monster Jamtm and The Pink Panthertm positively impacted comparable sales.
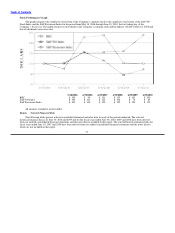
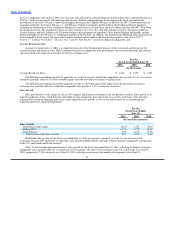
Average Restaurant Sales
Average restaurant sales, or ARS, is an important measure of the financial performance of our restaurants and changes in the
overall direction and trends of sales. ARS is influenced mostly by comparable sales performance and restaurant openings and closures
and also includes the impact of movement in currency exchange rates.
For the
Fiscal Years Ended June 30,
2010 2009 2008
(In thousands)
Average Restaurant Sales $ 1,244 $ 1,259 $ 1,301
Our ARS decreased during fiscal 2010, primarily as a result of negative worldwide comparable sales growth of 2.3% (in constant
currencies) partially offset by $15,000 favorable impact from the movement of currency exchange rates.
Our ARS decreased during fiscal 2009, primarily a result of a $55,000 unfavorable impact from the movement of currency
exchange rates, partially offset by worldwide comparable sales growth of 1.2% (in constant currencies).
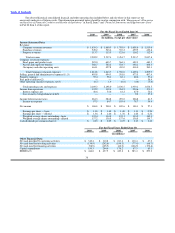
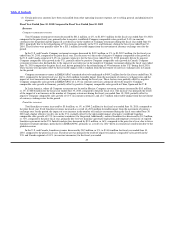
Sales Growth
Sales growth refers to the change in sales at all Company and franchise restaurants from one period to another. Sales growth is an
important indicator of the overall direction and trends of sales and income from operations on a system−wide basis. Sales growth is
influenced by restaurant openings and closures and comparable sales growth, as well as the effectiveness of our advertising and
marketing initiatives and featured products.
For the
Fiscal Years Ended
June 30,
2010 2009 2008
(In constant currencies)
Sales Growth:
United States and Canada (3.1)% 1.2% 6.0%
EMEA/APAC 13.1% 9.7% 12.6%
Latin America 4.8% 8.5% 13.1%
Total System−wide Sales Growth 2.1% 4.2% 8.3%
Worldwide sales growth for the fiscal year ended June 30, 2010 was positive, primarily as result of a net increase of 249
restaurants in fiscal 2010 and positive comparable sales growth in EMEA/APAC, partially offset by negative comparable sales growth
in the U.S. and Canada and Latin America.
The U.S. and Canada experienced negative sales growth for the fiscal year ended June 30, 2010, reflecting the impact of negative
comparable sales, partially offset by a net increase of 15 restaurants. We had 7,549 restaurants in the U.S. and Canada as of June 30,
2010, compared to 7,534 restaurants as of June 30, 2009, reflecting an increase in the number of restaurants of less than 1%.
47