Burger King 2010 Annual Report Download - page 100
Download and view the complete annual report
Please find page 100 of the 2010 Burger King annual report below. You can navigate through the pages in the report by either clicking on the pages listed below, or by using the keyword search tool below to find specific information within the annual report.-
 1
1 -
2
-
3
-
4
-
5
-
6
-
7
-
8
-
9
-
10
-
11
-
12
-
13
-
14
-
15
-
16
-
17
-
18
-
19
-
20
-
21
-
22
-
23
-
24
-
25
-
26
-
27
-
28
-
29
-
30
-
31
-
32
-
33
-
34
-
35
-
36
-
37
-
38
-
39
-
40
-
41
-
42
-
43
-
44
-
45
-
46
-
47
-
48
-
49
-
50
-
51
-
52
-
53
-
54
-
55
-
56
-
57
-
58
-
59
-
60
-
61
-
62
-
63
-
64
-
65
-
66
-
67
-
68
-
69
-
70
-
71
-
72
-
73
-
74
-
75
-
76
-
77
-
78
-
79
-
80
-
81
-
82
-
83
-
84
-
85
-
86
-
87
-
88
-
89
-
 90
90 -
 91
91 -
 92
92 -
 93
93 -
 94
94 -
 95
95 -
 96
96 -
 97
97 -
 98
98 -
 99
99 -
 100
100 -
 101
101 -
 102
102 -
 103
103 -
 104
104 -
 105
105 -
 106
106 -
 107
107 -
 108
108 -
 109
109 -
 110
110 -
111
-
112
-
113
-
114
-
115
-
116
-
117
-
118
-
119
-
120
-
121
-
122
-
123
-
124
-
125
-
126
-
127
-
128
-
129
-
130
-
131
-
132
-
133
-
134
-
135
-
136
-
137
-
138
-
139
-
140
-
141
-
142
-
143
-
144
-
145
-
146
 |
 |

Table of Contents
BURGER KING HOLDINGS, INC. AND SUBSIDIARIES
Notes to Consolidated Financial Statements — (Continued)
and tax benefits realized from the dissolution of dormant entities. The Company’s effective tax rate was 35.3% for the fiscal year ended
June 30, 2008, primarily as a result of the resolution of federal, state and international audits, dissolution of a foreign partnership, and
changes in state and foreign tax law.
Income tax expense includes an decrease in valuation allowance related to deferred tax assets in foreign countries of $1.7 million
for the year ended June 30, 2010, an increase of $3.0 million for the year ended June 30, 2009 and a decrease of $7.1 million for the
year ended June 30, 2008. The decrease in valuation allowance for the year ended June 30, 2010 is a result of changes in the projected
utilization of deferred tax assets in foreign jurisdictions.
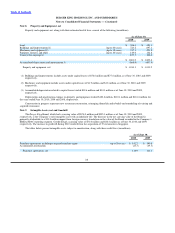
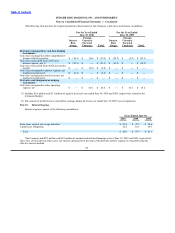
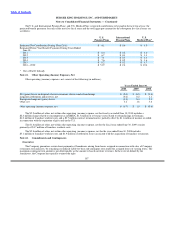
The following table provides the amount of income tax expense (benefit) allocated to continuing operations and amounts
separately allocated to other items (in millions):
Years Ended June 30,
2010 2009 2008
Income tax expense from continuing operations $ 97.5 $ 84.7 $ 103.4
Interest rate swaps in accumulated
other comprehensive income (loss) 2.0 (11.0) (5.0)
Pension liability in accumulated other comprehensive income (loss) (11.3) (9.4) (4.5)
Adjustments to deferred income taxes related to Brand — (0.2) (2.4)
Adjustments to the valuation allowance
related to Brand — (0.3) (6.5)
Stock option tax benefit in additional paid−in capital (3.5) (3.3) (9.3)
$ 84.7 $ 60.5 $ 75.7
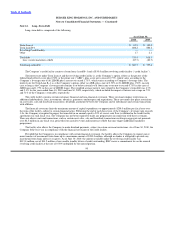
The significant components of deferred income tax expense (benefit) attributable to income from continuing operations are as
follows (in millions):
Years Ended June 30,
2010 2009 2008
Deferred income tax expense (exclusive of the effects of components listed below) $ 15.7 $ 3.2 $ 20.3
Change in valuation allowance (net of amounts allocated as adjustments to purchase accounting in
2009 and 2008) (1.7) 3.0 (7.1)
Change in effective state income tax rate 0.8 4.5 —
Change in effective foreign income tax rate 2.1 1.4 7.1
Total $ 16.9 $ 12.1 $ 20.3
97