Burger King 2010 Annual Report Download - page 46
Download and view the complete annual report
Please find page 46 of the 2010 Burger King annual report below. You can navigate through the pages in the report by either clicking on the pages listed below, or by using the keyword search tool below to find specific information within the annual report.-
 1
1 -
2
-
3
-
4
-
5
-
6
-
7
-
8
-
9
-
10
-
11
-
12
-
13
-
14
-
15
-
16
-
17
-
18
-
19
-
20
-
21
-
22
-
23
-
24
-
25
-
26
-
27
-
28
-
29
-
30
-
31
-
32
-
33
-
34
-
35
-
 36
36 -
 37
37 -
 38
38 -
 39
39 -
 40
40 -
 41
41 -
 42
42 -
 43
43 -
 44
44 -
 45
45 -
 46
46 -
 47
47 -
 48
48 -
 49
49 -
 50
50 -
 51
51 -
 52
52 -
 53
53 -
 54
54 -
 55
55 -
 56
56 -
57
-
58
-
59
-
60
-
61
-
62
-
63
-
64
-
65
-
66
-
67
-
68
-
69
-
70
-
71
-
72
-
73
-
74
-
75
-
76
-
77
-
78
-
79
-
80
-
81
-
82
-
83
-
84
-
85
-
86
-
87
-
88
-
89
-
90
-
91
-
92
-
93
-
94
-
95
-
96
-
97
-
98
-
99
-
100
-
101
-
102
-
103
-
104
-
105
-
106
-
107
-
108
-
109
-
110
-
111
-
112
-
113
-
114
-
115
-
116
-
117
-
118
-
119
-
120
-
121
-
122
-
123
-
124
-
125
-
126
-
127
-
128
-
129
-
130
-
131
-
132
-
133
-
134
-
135
-
136
-
137
-
138
-
139
-
140
-
141
-
142
-
143
-
144
-
145
-
146
 |
 |

Table of Contents
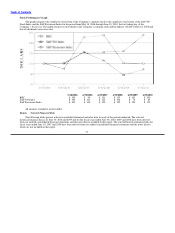
Fiscal 2010 Highlights
Highlights of our fiscal 2010 performance include:
• continued acceleration of system−wide restaurant growth with 249 net new openings during fiscal 2010;
positive net restaurant growth across all segments with over 90% of the increase realized outside of the
United States and Canada;
• worldwide revenues of $2.5 billion for fiscal 2010;
• worldwide average restaurant sales for fiscal 2010 of $1.2 million system−wide, which includes the
favorable impact of currency exchange rates of $15,000;
• net growth of 15 restaurants in the United States and Canada, the third year in a row that we have
increased our restaurant count in this segment;
• worldwide system restaurant count of 12,174 at June 30, 2010, our highest restaurant count in the history
of the brand;
• entry into Russia with the opening of six restaurants in Moscow in fiscal 2010;
• successful execution of our portfolio management strategy, including strategic acquisitions of 39
restaurants and 91 refranchisings;
• continued focus on our barbell menu strategy with premium offerings such as the Steakhouse XT burger
line and BK Fire−Grilled Ribs limited−time offer and affordable value offerings such as the 1/4 lb. Double
Cheeseburger and Buck Double; and
• paid down $67.7 million of debt and capital leases.
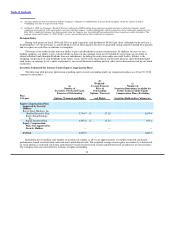
Key Business Measures
We use three key business measures as indicators of the Company’s operational performance: comparable sales growth, average
restaurant sales and sales growth. These measures are important indicators of the overall direction, trends of sales and the effectiveness
of the Company’s advertising, marketing and operating initiatives and the impact of these on the entire Burger King system.
Comparable sales growth and sales growth are provided by reportable segments and are analyzed on a constant currency basis, which
means they are calculated by translating current year results at prior year average exchange rates to remove the effects of currency
fluctuations from these trend analyses. We believe these constant currency measures provide a more meaningful analysis of our
business by identifying the underlying business trend, without distortion from the effect of currency movements.
44