Burger King 2010 Annual Report Download - page 44
Download and view the complete annual report
Please find page 44 of the 2010 Burger King annual report below. You can navigate through the pages in the report by either clicking on the pages listed below, or by using the keyword search tool below to find specific information within the annual report.-
 1
1 -
2
-
3
-
4
-
5
-
6
-
7
-
8
-
9
-
10
-
11
-
12
-
13
-
14
-
15
-
16
-
17
-
18
-
19
-
20
-
21
-
22
-
23
-
24
-
25
-
26
-
27
-
28
-
29
-
30
-
31
-
32
-
33
-
 34
34 -
 35
35 -
 36
36 -
 37
37 -
 38
38 -
 39
39 -
 40
40 -
 41
41 -
 42
42 -
 43
43 -
 44
44 -
 45
45 -
 46
46 -
 47
47 -
 48
48 -
 49
49 -
 50
50 -
 51
51 -
 52
52 -
 53
53 -
 54
54 -
55
-
56
-
57
-
58
-
59
-
60
-
61
-
62
-
63
-
64
-
65
-
66
-
67
-
68
-
69
-
70
-
71
-
72
-
73
-
74
-
75
-
76
-
77
-
78
-
79
-
80
-
81
-
82
-
83
-
84
-
85
-
86
-
87
-
88
-
89
-
90
-
91
-
92
-
93
-
94
-
95
-
96
-
97
-
98
-
99
-
100
-
101
-
102
-
103
-
104
-
105
-
106
-
107
-
108
-
109
-
110
-
111
-
112
-
113
-
114
-
115
-
116
-
117
-
118
-
119
-
120
-
121
-
122
-
123
-
124
-
125
-
126
-
127
-
128
-
129
-
130
-
131
-
132
-
133
-
134
-
135
-
136
-
137
-
138
-
139
-
140
-
141
-
142
-
143
-
144
-
145
-
146
 |
 |

Table of Contents
Overview
We operate in the fast food hamburger restaurant, or FFHR, category of the quick service restaurant, or QSR, segment of the
restaurant industry. We are the second largest FFHR chain in the world as measured by number of restaurants and system−wide sales.
Our system of restaurants includes restaurants owned by us, as well as our franchisees. Our business operates in three reportable
segments: (1) the United States and Canada; (2) Europe, the Middle East, Africa and Asia Pacific, or EMEA/APAC; and (3) Latin
America.
Approximately 90% of our current restaurants are franchised, but we expect the percentage of franchise restaurants to increase
significantly as we implement our portfolio management strategy of refranchising up to half of our Company restaurants within the next
three to five years. The current 90/10 ratio of franchise restaurants to Company restaurants applies on a worldwide basis, but may not
reflect the ratio of franchise restaurants to Company restaurants in any specific market or region. We believe that a restaurant ownership
mix that is heavily weighted to franchise restaurants is beneficial to us because the capital required to grow and maintain our system is
funded primarily by franchisees while giving us a base of Company restaurants to demonstrate credibility with franchisees in launching
new initiatives. However, our franchise dominated business model also presents a number of drawbacks and risks, such as our limited
control over franchisees and limited ability to facilitate changes in restaurant ownership. In addition, our operating results are closely
tied to the success of our franchisees, and we are dependent on franchisees to open new restaurants as part of our growth strategy.
Our international operations are impacted by fluctuations in currency exchange rates. In Company markets located outside of the
U.S., we generate revenues and incur expenses denominated in local currencies. These revenues and expenses are translated using the
average rates during the period in which they are recognized, and are impacted by changes in currency exchange rates. In many of our
franchise markets, our franchisees pay royalties to us in currencies other than the local currency in which they operate; however, as the
royalties are calculated based on local currency sales, our revenues are still impacted by fluctuations in currency exchange rates. We
review and analyze business results excluding the effect of currency translation and calculate certain incentive compensation for
management and corporate level employees based on these results believing this better represents our underlying business trends.
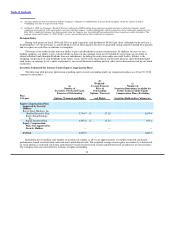
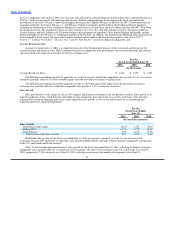
Revenues
In fiscal 2010, segment revenues and income from operations, excluding unallocated corporate general and administrative
expenses, were allocated as follows:
Revenues Income from Operations
Segment:
U.S. & Canada 68% 74%
EMEA/APAC 28% 18%
Latin America 4% 8%
Total 100% 100%
We generate revenues from three sources: retail sales at Company restaurants; franchise revenues, consisting of royalties based on
a percentage of sales reported by franchise restaurants and franchise fees paid to us by our franchisees; and property income from
restaurants that we lease or sublease to franchisees. In fiscal 2010, Company restaurant revenues and franchise revenues represented
73.5% and 22.0% of total revenues, respectively. The remaining 4.5% of total revenues was derived from property income.
Restaurant sales are typically higher in the spring and summer months (our fourth and first fiscal quarters) when weather is
warmer than in the fall and winter months (our second and third fiscal quarters). Restaurant sales during the winter are typically highest
in December, during the holiday shopping season. Our restaurant sales and Company restaurant margins are typically lowest during our
third fiscal quarter, which occurs during the winter months and includes February, the shortest month of the year. Furthermore, adverse
weather conditions which
42