Burger King 2010 Annual Report Download - page 91
Download and view the complete annual report
Please find page 91 of the 2010 Burger King annual report below. You can navigate through the pages in the report by either clicking on the pages listed below, or by using the keyword search tool below to find specific information within the annual report.-
 1
1 -
2
-
3
-
4
-
5
-
6
-
7
-
8
-
9
-
10
-
11
-
12
-
13
-
14
-
15
-
16
-
17
-
18
-
19
-
20
-
21
-
22
-
23
-
24
-
25
-
26
-
27
-
28
-
29
-
30
-
31
-
32
-
33
-
34
-
35
-
36
-
37
-
38
-
39
-
40
-
41
-
42
-
43
-
44
-
45
-
46
-
47
-
48
-
49
-
50
-
51
-
52
-
53
-
54
-
55
-
56
-
57
-
58
-
59
-
60
-
61
-
62
-
63
-
64
-
65
-
66
-
67
-
68
-
69
-
70
-
71
-
72
-
73
-
74
-
75
-
76
-
77
-
78
-
79
-
80
-
 81
81 -
 82
82 -
 83
83 -
 84
84 -
 85
85 -
 86
86 -
 87
87 -
 88
88 -
 89
89 -
 90
90 -
 91
91 -
 92
92 -
 93
93 -
 94
94 -
 95
95 -
 96
96 -
 97
97 -
 98
98 -
 99
99 -
 100
100 -
 101
101 -
102
-
103
-
104
-
105
-
106
-
107
-
108
-
109
-
110
-
111
-
112
-
113
-
114
-
115
-
116
-
117
-
118
-
119
-
120
-
121
-
122
-
123
-
124
-
125
-
126
-
127
-
128
-
129
-
130
-
131
-
132
-
133
-
134
-
135
-
136
-
137
-
138
-
139
-
140
-
141
-
142
-
143
-
144
-
145
-
146
 |
 |

Table of Contents
BURGER KING HOLDINGS, INC. AND SUBSIDIARIES
Notes to Consolidated Financial Statements — (Continued)
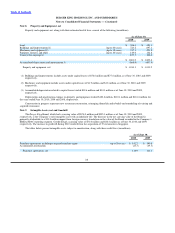
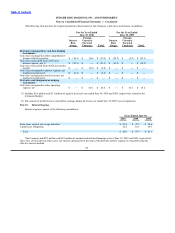
Note 8. Property and Equipment, net
Property and equipment, net, along with their estimated useful lives, consist of the following (in millions):
As of June 30,
2010 2009
Land $ 386.0 $ 390.3
Buildings and improvements(1) (up to 40 years) 723.2 697.1
Machinery and equipment(2) (up to 18 years) 317.3 293.8
Furniture, fixtures, and other (up to 10 years) 149.0 132.8
Construction in progress 105.5 106.6
$ 1,681.0 $ 1,620.6
Accumulated depreciation and amortization(3) (666.9) (607.4)
Property and equipment, net $ 1,014.1 $ 1,013.2
(1) Buildings and improvements include assets under capital leases of $76.6 million and $75.6 million as of June 30, 2010 and 2009,
respectively.
(2) Machinery and equipment include assets under capital leases of $1.9 million and $1.8 million as of June 30, 2010 and 2009,
respectively.
(3) Accumulated depreciation related to capital leases totaled $38.6 million and $34.1 million as of June 30, 2010 and 2009,
respectively.
Depreciation and amortization expense on property and equipment totaled $120.6 million, $110.1 million and $116.6 million for
the years ended June 30, 2010, 2009 and 2008, respectively.
Construction in progress represents new restaurant construction, reimaging (demolish and rebuild) and remodeling of existing and
acquired restaurants.
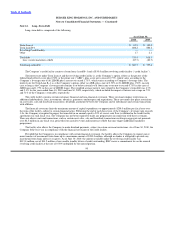
Note 9. Intangible Assets, net and Goodwill
The Burger King Brand, which had a carrying value of $874.0 million and $905.1 million as of June 30, 2010 and 2009,
respectively, is the Company’s only intangible asset with an indefinite life. The decrease in the net carrying value of the Brand is
primarily attributable to a $31.0 million impact from foreign currency translation on the value of the Brand recorded in the Company’s
EMEA/APAC reporting segment. Goodwill had a carrying value of $31.0 million and $26.4 million as of June 30, 2010 and 2009,
respectively. The increase in goodwill during 2010 resulted from the acquisition of 35 restaurants in Singapore.
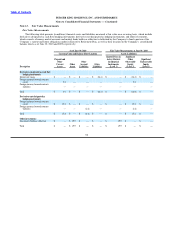
The tables below present intangible assets subject to amortization, along with their useful lives (in millions):
As of June 30,
2010 2009
Franchise agreements including reacquired franchise rights (up to 26 years) $ 142.2 $ 140.6
Accumulated amortization (25.3) (19.5)
Franchise agreements, net 116.9 121.1
88