Burger King 2010 Annual Report Download - page 10
Download and view the complete annual report
Please find page 10 of the 2010 Burger King annual report below. You can navigate through the pages in the report by either clicking on the pages listed below, or by using the keyword search tool below to find specific information within the annual report.-
 1
1 -
 2
2 -
 3
3 -
 4
4 -
 5
5 -
 6
6 -
 7
7 -
 8
8 -
 9
9 -
 10
10 -
 11
11 -
 12
12 -
 13
13 -
 14
14 -
 15
15 -
 16
16 -
 17
17 -
 18
18 -
 19
19 -
 20
20 -
 21
21 -
22
-
23
-
24
-
25
-
26
-
27
-
28
-
29
-
30
-
31
-
32
-
33
-
34
-
35
-
36
-
37
-
38
-
39
-
40
-
41
-
42
-
43
-
44
-
45
-
46
-
47
-
48
-
49
-
50
-
51
-
52
-
53
-
54
-
55
-
56
-
57
-
58
-
59
-
60
-
61
-
62
-
63
-
64
-
65
-
66
-
67
-
68
-
69
-
70
-
71
-
72
-
73
-
74
-
75
-
76
-
77
-
78
-
79
-
80
-
81
-
82
-
83
-
84
-
85
-
86
-
87
-
88
-
89
-
90
-
91
-
92
-
93
-
94
-
95
-
96
-
97
-
98
-
99
-
100
-
101
-
102
-
103
-
104
-
105
-
106
-
107
-
108
-
109
-
110
-
111
-
112
-
113
-
114
-
115
-
116
-
117
-
118
-
119
-
120
-
121
-
122
-
123
-
124
-
125
-
126
-
127
-
128
-
129
-
130
-
131
-
132
-
133
-
134
-
135
-
136
-
137
-
138
-
139
-
140
-
141
-
142
-
143
-
144
-
145
-
146
 |
 |

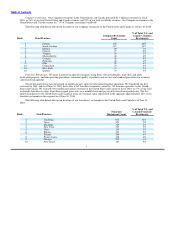
Table of Contents
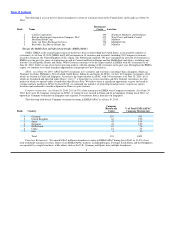
The following is a list of the five largest franchisees in terms of restaurant count in the United States and Canada as of June 30,
2010:
Restaurant
Rank Name Count Location
1 Carrols Corporation 309 Northeast, Midwest, and Southeast
2 Stategic Restaurants Acquisition Company, LLC 275 West Coast and South−Central
3 Heartland Food Corp. 223 Midwest
4 Army Air Force Exchange Services 132 Multiple USA
5 Bravokilo, Inc./Bravo Grande, Inc. 117 Midwest
Europe, the Middle East and Africa/Asia Pacific (EMEA/APAC)
EMEA. EMEA is the second largest region in the Burger King system behind the United States, as measured by number of
restaurants. As of June 30, 2010, EMEA had 2,680 restaurants in 34 countries and territories, including 241 Company restaurants
located in Germany, the United Kingdom (U.K.), Spain, The Netherlands and Italy. We have expanded our network of restaurants in
EMEA over the past two years via contiguous growth in Central and Eastern Europe and the Middle East and Africa, including entry
into the Czech Republic, Russia and Oman. While Germany continues to be the largest market in EMEA with 685 restaurants as of
June 30, 2010, Turkey is one of our fastest growing markets with the opening of 68 restaurants in the past year. Throughout the EMEA
region, we continue to evaluate franchise opportunities and prospective new franchisees.
APAC. As of June 30, 2010, APAC had 807 restaurants in 13 countries and territories, including China, Singapore, Malaysia,
Thailand, Australia, Philippines, New Zealand, South Korea, Indonesia and Japan. In APAC, we have 62 Company restaurants, all of
which are located in China and Singapore. Australia is the largest market in APAC, with 340 restaurants as of June 30, 2010, all of
which are franchised and operated under Hungry Jack’s®, a brand that we own in Australia and New Zealand. Australia is the only
market in which we operate under a brand other than Burger King. We believe there is significant opportunity to grow the brand in
existing and new markets in APAC. In fiscal 2010, we continued our initiative of projecting brand presence via gateway airport
locations and continued to seed development in China via joint ventures.
Company restaurants: As of June 30, 2010, 241 (or 9%) of the restaurants in EMEA were Company restaurants. As of June 30,
2010, there were 62 Company restaurants in APAC, of which 21 were located in China and 41 in Singapore. During fiscal 2010, we
opened six Company restaurants in Singapore and acquired 35 restaurants from a franchisee in Singapore.
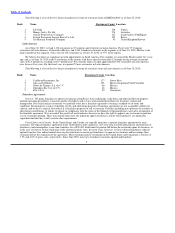
The following table details Company restaurant locations in EMEA/APAC as of June 30, 2010:
Company
Restaurant % of Total EMEA/APAC
Rank Country Count Company Restaurants
1 Germany 107 35%
2 United Kingdom 63 21%
3 Spain 45 15%
4 Singapore 41 14%
5 Netherlands 22 7%
6 China 21 7%
7 Italy 4 1%
Total 303 100%
Franchise Restaurants: We earned $186.2 million in franchise revenues in EMEA/APAC during fiscal 2010, or 33.9% of our
total worldwide franchise revenues. Many of our EMEA/APAC markets, including Hungary, Portugal, South Korea and the Philippines,
are operated by a single franchisee, while others, such as the U.K., Germany and Spain, have multiple franchisees.
8