Burger King 2010 Annual Report Download - page 54
Download and view the complete annual report
Please find page 54 of the 2010 Burger King annual report below. You can navigate through the pages in the report by either clicking on the pages listed below, or by using the keyword search tool below to find specific information within the annual report.-
 1
1 -
2
-
3
-
4
-
5
-
6
-
7
-
8
-
9
-
10
-
11
-
12
-
13
-
14
-
15
-
16
-
17
-
18
-
19
-
20
-
21
-
22
-
23
-
24
-
25
-
26
-
27
-
28
-
29
-
30
-
31
-
32
-
33
-
34
-
35
-
36
-
37
-
38
-
39
-
40
-
41
-
42
-
43
-
 44
44 -
 45
45 -
 46
46 -
 47
47 -
 48
48 -
 49
49 -
 50
50 -
 51
51 -
 52
52 -
 53
53 -
 54
54 -
 55
55 -
 56
56 -
 57
57 -
 58
58 -
 59
59 -
 60
60 -
 61
61 -
 62
62 -
 63
63 -
 64
64 -
65
-
66
-
67
-
68
-
69
-
70
-
71
-
72
-
73
-
74
-
75
-
76
-
77
-
78
-
79
-
80
-
81
-
82
-
83
-
84
-
85
-
86
-
87
-
88
-
89
-
90
-
91
-
92
-
93
-
94
-
95
-
96
-
97
-
98
-
99
-
100
-
101
-
102
-
103
-
104
-
105
-
106
-
107
-
108
-
109
-
110
-
111
-
112
-
113
-
114
-
115
-
116
-
117
-
118
-
119
-
120
-
121
-
122
-
123
-
124
-
125
-
126
-
127
-
128
-
129
-
130
-
131
-
132
-
133
-
134
-
135
-
136
-
137
-
138
-
139
-
140
-
141
-
142
-
143
-
144
-
145
-
146
 |
 |

Table of Contents
assets and accelerated depreciation associated with strategic initiatives, such as our restaurant reimaging program and our new POS
system. These factors were partially offset by a net decrease in the number of Company restaurants during the fiscal year ended June 30,
2010, favorable adjustments to the self−insurance reserve in the U.S., lower utility costs and lower start−up expenses as a result of
fewer Company restaurant openings and acquisitions.
As a percentage of Company restaurant revenues, occupancy and other operating costs increased by 0.8% to 25.1% for the fiscal
year ended June 30, 2010, compared to the prior fiscal year, primarily as a result of the adverse impact of sales deleverage on our fixed
occupancy and other operating costs due to negative Company comparable sales across all segments and the increases in occupancy and
other operating costs discussed above. These factors were partially offset by the benefits realized from favorable adjustments to the
self−insurance reserve in the U.S. as noted above.
In the U.S. and Canada, occupancy and other operating costs decreased by $8.2 million, or 3%, to $298.6 million for the fiscal
year ended June 30, 2010, compared to the prior fiscal year. The decrease was primarily driven by a net reduction in the number of
Company restaurants during the fiscal year, favorable adjustments to the self−insurance reserve in the U.S., lower utility costs and
lower start−up expenses as a result of fewer Company restaurant openings and acquisitions. These factors were partially offset by
additional depreciation expense resulting from an increase in depreciable assets and accelerated depreciation associated with the
strategic initiatives discussed above, and a $3.0 million unfavorable impact from the movement of currency exchange rates. As a
percentage of Company restaurant revenues, occupancy and other operating costs increased by 0.1% to 23.2%, primarily due to the
adverse impact of sales deleverage on our fixed occupancy and other operating costs and increased depreciation expense as noted
above, partially offset by the benefits realized from adjustments to the self−insurance reserve in the U.S.
In EMEA/APAC, occupancy and other operating costs increased by $11.5 million, or 9%, to $144.7 million for the fiscal year
ended June 30, 2010, compared to the prior fiscal year. The increase was primarily due to a net increase in the number of Company
restaurants during the fiscal year, a $1.4 million unfavorable impact from the movement of currency exchange rates, primarily in
EMEA, an increase in start−up expenses related to new restaurant openings and higher repair and maintenance costs, primarily in
Germany in conjunction with our refranchising initiative. As a percentage of Company restaurant revenues, occupancy and other
operating costs increased by 2.3% to 29.6%, primarily due to the adverse impact of sales deleverage on our fixed occupancy and other
operating costs.
There was no significant change in occupancy and other operating costs in Latin America for the fiscal year ended June 30, 2010,
compared to the prior fiscal year.
Selling, general and administrative expenses
Selling expenses decreased by $2.0 million, or 2%, to $91.3 million for the fiscal year ended June 30, 2010, compared to the prior
fiscal year, primarily due to a $3.5 million reduction in contributions to the marketing funds in our Company restaurant markets as a
result of lower Company restaurants revenues. Partially offsetting this decrease was an increase of $1.0 million of higher local
marketing expenditures aimed at driving incremental sales and $0.6 million from the movement of currency exchange rates for the
period.
General and administrative expenses increased by $3.5 million, or 1%, to $404.5 million for the fiscal year ended June 30, 2010,
compared to the prior fiscal year, largely driven by an increase in professional fees of $4.7 million, primarily related to information
technology initiatives, incremental depreciation expense of $2.6 million due to a higher depreciable asset base compared to prior year,
and higher salary and fringe benefit costs of $3.0 million including share−based compensation. These items were partially offset by
savings from reductions in travel and meetings of $4.1 million and office operating expenses of $3.2 million. These fluctuations include
the unfavorable impact form the movement of currency exchange rates of $4.3 million for the fiscal year ended June 30, 2010.
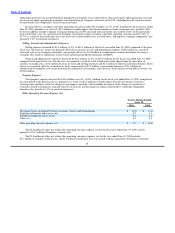
Property Expenses
Total property expenses increased by $1.3 million, or 2%, to $59.4 million for the fiscal year ended June 30, 2010, compared to
the prior fiscal year, primarily attributable to increased rent expense resulting from the net effect
52