Burger King 2010 Annual Report Download - page 98
Download and view the complete annual report
Please find page 98 of the 2010 Burger King annual report below. You can navigate through the pages in the report by either clicking on the pages listed below, or by using the keyword search tool below to find specific information within the annual report.-
 1
1 -
2
-
3
-
4
-
5
-
6
-
7
-
8
-
9
-
10
-
11
-
12
-
13
-
14
-
15
-
16
-
17
-
18
-
19
-
20
-
21
-
22
-
23
-
24
-
25
-
26
-
27
-
28
-
29
-
30
-
31
-
32
-
33
-
34
-
35
-
36
-
37
-
38
-
39
-
40
-
41
-
42
-
43
-
44
-
45
-
46
-
47
-
48
-
49
-
50
-
51
-
52
-
53
-
54
-
55
-
56
-
57
-
58
-
59
-
60
-
61
-
62
-
63
-
64
-
65
-
66
-
67
-
68
-
69
-
70
-
71
-
72
-
73
-
74
-
75
-
76
-
77
-
78
-
79
-
80
-
81
-
82
-
83
-
84
-
85
-
86
-
87
-
 88
88 -
 89
89 -
 90
90 -
 91
91 -
 92
92 -
 93
93 -
 94
94 -
 95
95 -
 96
96 -
 97
97 -
 98
98 -
 99
99 -
 100
100 -
 101
101 -
 102
102 -
 103
103 -
 104
104 -
 105
105 -
 106
106 -
 107
107 -
 108
108 -
109
-
110
-
111
-
112
-
113
-
114
-
115
-
116
-
117
-
118
-
119
-
120
-
121
-
122
-
123
-
124
-
125
-
126
-
127
-
128
-
129
-
130
-
131
-
132
-
133
-
134
-
135
-
136
-
137
-
138
-
139
-
140
-
141
-
142
-
143
-
144
-
145
-
146
 |
 |

Table of Contents
BURGER KING HOLDINGS, INC. AND SUBSIDIARIES
Notes to Consolidated Financial Statements — (Continued)
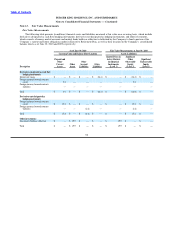
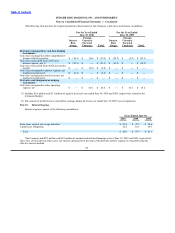
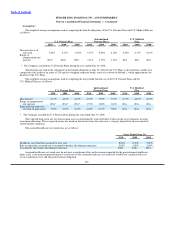
The following table presents the required quantitative disclosures for the Company’s derivative instruments (in millions):
For the Year Ended For the Year Ended
June 30, 2010 June 30, 2009
Foreign Foreign
Interest Currency Interest Currency
Rate Forward Rate Forward
Swaps Contracts Total Swaps Contracts Total
Derivatives designated as cash flow hedging
instruments:
Gain (loss) recognized in other comprehensive
income (effective portion) $ (16.4) $ (0.6) $ (17.0) $ (39.2) $ (0.1) $ (39.3)
Gain (loss) reclassified from AOCI into
interest expense, net(1) $ (21.1) $ — $ (21.1) $ (10.5) $ — $ (10.5)
Gain (loss) reclassified from AOCI into royalty
income $ — $ (0.8) $ (0.8) $ — $ — $ —
Gain (loss) recognized in interest expense, net
(ineffective portion)(2) $ (0.2) $ — $ (0.2) $ — $ — $ —
Gain (loss) recognized in royalty income, net
(ineffective portion)(2) $ — $ — $ — $ — $ — $ —
Derivatives not designated as hedging
instruments:
Gain (loss) recognized in other operating
expense, net $ — $ 44.6 $ 44.6 $ — $ 43.2 $ 43.2
(1) Includes $1.6 million and $1.3 million of gain for the fiscal year ended June 30, 2010 and 2009, respectively, related to the
terminated hedges.
(2) The amount of ineffectiveness recorded in earnings during the fiscal year ended June 30 2009 was not significant.
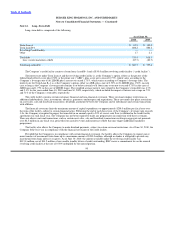
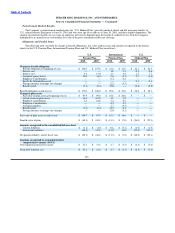
Note 15. Interest Expense
Interest expense consists of the following (in millions):
Years Ended June 30,
2010 2009 2008
Term loans, interest rate swaps and other $ 39.4 $ 47.2 $ 56.4
Capital lease obligations 10.2 10.1 10.7
Total $ 49.6 $ 57.3 $ 67.1
The Company had $2.9 million and $4.9 million of unamortized deferred financing costs at June 30, 2010 and 2009, respectively.
These fees are classified in other assets, net and are amortized over the term of the debt into interest expense on term debt using the
effective interest method.
95