Burger King 2010 Annual Report Download - page 62
Download and view the complete annual report
Please find page 62 of the 2010 Burger King annual report below. You can navigate through the pages in the report by either clicking on the pages listed below, or by using the keyword search tool below to find specific information within the annual report.
Table of Contents
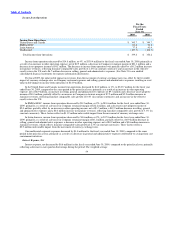
interest rates for the fiscal years ended June 30, 2009 and 2008 were 5.1% and 6.0%, respectively, which included the effect of interest
rate swaps on 71% and 56% of our term debt, respectively.
Income Tax Expense
Income tax expense was $84.7 million for the fiscal year ended June 30, 2009, resulting in an effective tax rate of 29.7% primarily
due to the resolution of federal and state audits and tax benefits realized from the dissolution of dormant foreign entities.
See Note 16 to our consolidated financial statements for further information regarding our effective tax rate. See Item 1A “Risk
Factors” in Part I of this report for a discussion regarding our ability to utilize foreign tax credits and estimate deferred tax assets.
Net Income
Our net income increased by $10.5 million, or 6%, to $200.1 million in fiscal 2009, compared to the same period in the prior fiscal
year, primarily as a result of an $18.7 million decrease in income tax expense, increased franchise revenues of $6.2 million, driven by a
net increase in restaurants and positive franchise comparable sales growth, a $6.7 million decrease in selling, general and administrative
expenses and the benefit from a $6.6 million decrease in interest expense, net. These factors were partially offset by a net change of
$2.5 million in other operating expense, net, a decrease in Company restaurant margin of $21.1 million and a decrease in net property
income of $4.1 million.
Liquidity and Capital Resources
Overview
We had cash and cash equivalents of $187.6 million and $121.7 million as of June 30, 2010 and 2009, respectively. In addition, as
of June 30, 2010, we had a borrowing capacity of $115.8 million under our $150.0 million revolving credit facility. Cash provided by
operations was $310.4 million in fiscal 2010, compared to $310.8 million in fiscal 2009.
In each of the years ended June 30, 2010 and 2009, we paid four quarterly dividends of $0.0625 per share of common stock,
resulting in $34.2 million and $34.1 million, respectively, of cash payments to shareholders of record. During the first quarter of fiscal
2011, we declared a quarterly dividend of $0.0625 per share of common stock that is payable on September 30, 2010 to shareholders of
record on September 14, 2010.
During the third quarter of fiscal 2009, our board of directors approved and the Company announced a share repurchase program
to repurchase up to $200 million of our common stock in the open market from time to time prior to December 31, 2010. We may use a
portion of our excess cash to repurchase shares under our share repurchase program depending on market conditions. No shares have
been purchased under the new share repurchase program to date.
Long−Term Debt
Our long−term debt is comprised of a senior secured credit facility, which consists of Term Loan A, Term Loan B−1 and a
$150.0 million revolving credit facility (the “Credit Facility”). The maturity date of Term Loan A and the revolving credit facility is
June 30, 2011, and the maturity date of Term Loan B−1 is June 30, 2012.
The Credit Facility contains certain customary financial and non−financial covenants. These covenants impose restrictions on
additional indebtedness, liens, investments, advances, guarantees and mergers and acquisitions. These covenants also place restrictions
on asset sales, sale and leaseback transactions, dividends, payments between us and our subsidiaries and certain transactions with
affiliates.
The financial covenants limit the maximum amount of capital expenditures to approximately $200 million per fiscal year over the
term of the facility, subject to certain financial ratios. Our leverage ratio, as defined by the Credit Facility, was 1.5x and 1.8x as of
June 30, 2010 and 2009, respectively. Following the end of each fiscal year, if our leverage ratio exceeds 3.0x, we are required to
prepay the term debt in an amount equal to 50% of excess cash flow
60


