Burger King 2010 Annual Report Download - page 51
Download and view the complete annual report
Please find page 51 of the 2010 Burger King annual report below. You can navigate through the pages in the report by either clicking on the pages listed below, or by using the keyword search tool below to find specific information within the annual report.-
 1
1 -
2
-
3
-
4
-
5
-
6
-
7
-
8
-
9
-
10
-
11
-
12
-
13
-
14
-
15
-
16
-
17
-
18
-
19
-
20
-
21
-
22
-
23
-
24
-
25
-
26
-
27
-
28
-
29
-
30
-
31
-
32
-
33
-
34
-
35
-
36
-
37
-
38
-
39
-
40
-
 41
41 -
 42
42 -
 43
43 -
 44
44 -
 45
45 -
 46
46 -
 47
47 -
 48
48 -
 49
49 -
 50
50 -
 51
51 -
 52
52 -
 53
53 -
 54
54 -
 55
55 -
 56
56 -
 57
57 -
 58
58 -
 59
59 -
 60
60 -
 61
61 -
62
-
63
-
64
-
65
-
66
-
67
-
68
-
69
-
70
-
71
-
72
-
73
-
74
-
75
-
76
-
77
-
78
-
79
-
80
-
81
-
82
-
83
-
84
-
85
-
86
-
87
-
88
-
89
-
90
-
91
-
92
-
93
-
94
-
95
-
96
-
97
-
98
-
99
-
100
-
101
-
102
-
103
-
104
-
105
-
106
-
107
-
108
-
109
-
110
-
111
-
112
-
113
-
114
-
115
-
116
-
117
-
118
-
119
-
120
-
121
-
122
-
123
-
124
-
125
-
126
-
127
-
128
-
129
-
130
-
131
-
132
-
133
-
134
-
135
-
136
-
137
-
138
-
139
-
140
-
141
-
142
-
143
-
144
-
145
-
146
 |
 |

Table of Contents
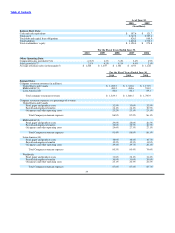
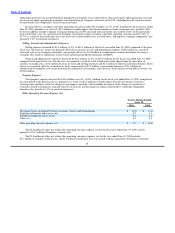
(1) Certain prior year amounts have been reclassified from other operating (income) expense, net to selling, general and administrative
expenses.
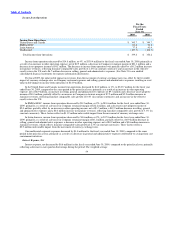
Fiscal Year Ended June 30, 2010 Compared to Fiscal Year Ended June 30, 2009
Revenues
Company restaurant revenues
Total Company restaurant revenues decreased by $41.2 million, or 2%, to $1,839.3 million for the fiscal year ended June 30, 2010,
compared to the prior fiscal year, primarily due to negative worldwide Company comparable sales growth of 2.4% (in constant
currencies) for the period and the impact of a net decrease in the number of Company restaurants during the fiscal year ended June 30,
2010, principally due to the refranchising of 91 restaurants, primarily in the U.S. and Germany, during the fiscal year ended June 30,
2010. These factors were partially offset by a $15.1 million favorable impact from the movement of currency exchange rates for the
period.
In the U.S. and Canada, Company restaurant revenues decreased by $42.3 million, or 3%, to $1,289.5 million, for the fiscal year
ended June 30, 2010, compared to the prior fiscal year. The decrease was the result of negative Company comparable sales growth in
the U.S. and Canada segment of 2.4% (in constant currencies) for the fiscal year ended June 30, 2010, primarily driven by negative
Company comparable sales growth in the U.S., partially offset by positive Company comparable sales growth in Canada. Company
restaurant revenues also declined due to the impact of a net decrease in the number of Company restaurants during the fiscal year ended
June 30, 2010 compared to the prior fiscal year, driven primarily by the refranchising of 54 restaurants in the U.S. during fiscal 2010.
These factors were partially offset by the favorable impact of $12.2 million from the movement of currency exchange rates in Canada
for the period.
Company restaurant revenues in EMEA/APAC remained relatively unchanged at $489.2 million for the fiscal year ended June 30,
2010, compared to the prior fiscal year, due to a $4.6 million favorable impact from the movement of currency exchange rates and the
impact of a net increase in the number of Company restaurants during the fiscal year. These factors were partially offset by negative
Company comparable sales growth in EMEA/APAC of 2.1% (in constant currencies), primarily driven by negative Company
comparable sales growth in Germany, partially offset by positive Company comparable sales growth in China, Spain and the U.K.
In Latin America, where all Company restaurants are located in Mexico, Company restaurant revenues increased by $0.5 million,
or 1%, to $60.6 million for the fiscal year ended June 30, 2010, compared to the prior fiscal year. The increase was primarily the result
of the impact of a net increase in the number of Company restaurants during the fiscal year ended June 30, 2010, partially offset by
negative Company comparable sales growth of 4.1% (in constant currencies) and a $1.7 million unfavorable impact from the movement
of currency exchange rates for the period.
Franchise revenues
Total franchise revenues increased by $5.8 million, or 1%, to $549.2 million for the fiscal year ended June 30, 2010, compared to
the prior fiscal year. Total franchise revenues increased as a result of a $5.6 million favorable impact from the movement of currency
exchange rates for the period, the impact of a net increase in the number of franchise restaurants during the fiscal year ended June 30,
2010 and a higher effective royalty rate in the U.S., partially offset by the unfavorable impact of negative worldwide franchise
comparable sales growth of 2.3% (in constant currencies) for the period. Additionally, renewal franchise fees decreased by $3.2 million,
or 31%, compared to the prior fiscal year, primarily due to fewer franchise agreement expirations and temporary extensions of expired
franchise agreements in the U.S. Initial franchise fees decreased by $2.3 million, or 16%, compared to the prior fiscal year, due to fewer
franchise restaurant openings, particularly in EMEA/APAC, primarily as a result of a slow−down in commercial construction due to the
global recession.
In the U.S. and Canada, franchise revenues decreased by $8.5 million, or 3%, to $314.6 million for fiscal year ended June 30,
2010, compared to the prior fiscal year. The decrease was primarily the result of negative franchise comparable sales growth in the
U.S. and Canada segment of 4.1% (in constant currencies) for the fiscal year ended
49