Burger King 2010 Annual Report Download - page 9
Download and view the complete annual report
Please find page 9 of the 2010 Burger King annual report below. You can navigate through the pages in the report by either clicking on the pages listed below, or by using the keyword search tool below to find specific information within the annual report.-
 1
1 -
 2
2 -
 3
3 -
 4
4 -
 5
5 -
 6
6 -
 7
7 -
 8
8 -
 9
9 -
 10
10 -
 11
11 -
 12
12 -
 13
13 -
 14
14 -
 15
15 -
 16
16 -
 17
17 -
 18
18 -
 19
19 -
 20
20 -
21
-
22
-
23
-
24
-
25
-
26
-
27
-
28
-
29
-
30
-
31
-
32
-
33
-
34
-
35
-
36
-
37
-
38
-
39
-
40
-
41
-
42
-
43
-
44
-
45
-
46
-
47
-
48
-
49
-
50
-
51
-
52
-
53
-
54
-
55
-
56
-
57
-
58
-
59
-
60
-
61
-
62
-
63
-
64
-
65
-
66
-
67
-
68
-
69
-
70
-
71
-
72
-
73
-
74
-
75
-
76
-
77
-
78
-
79
-
80
-
81
-
82
-
83
-
84
-
85
-
86
-
87
-
88
-
89
-
90
-
91
-
92
-
93
-
94
-
95
-
96
-
97
-
98
-
99
-
100
-
101
-
102
-
103
-
104
-
105
-
106
-
107
-
108
-
109
-
110
-
111
-
112
-
113
-
114
-
115
-
116
-
117
-
118
-
119
-
120
-
121
-
122
-
123
-
124
-
125
-
126
-
127
-
128
-
129
-
130
-
131
-
132
-
133
-
134
-
135
-
136
-
137
-
138
-
139
-
140
-
141
-
142
-
143
-
144
-
145
-
146
 |
 |

Table of Contents
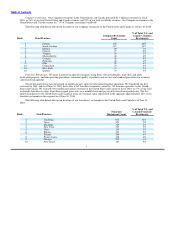
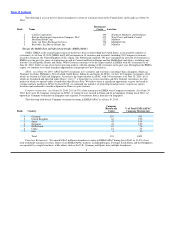
Company restaurants. Our Company restaurants in the United States and Canada generated $1.3 billion in revenues in fiscal
2010, or 76% of our total United States and Canada revenues and 52% of our total worldwide revenues. Our Company restaurants in the
United States and Canada account for 71% of Company restaurants worldwide.
The following table details the top ten locations of our Company restaurants in the United States and Canada as of June 30, 2010:
% of Total U.S. and
Company Restaurant Canada Company
Rank State/Province Count Restaurants
1 Florida 256 26%
2 North Carolina 112 11%
3 Indiana 69 7%
4 Ontario 57 6%
5 Virginia 50 5%
6 Massachusetts 44 4%
7 Georgia 42 4%
8 Nebraska 42 4%
9 Ohio 39 4%
10 Connecticut 33 3%
10 New York 33 3%
10 Quebec 33 3%
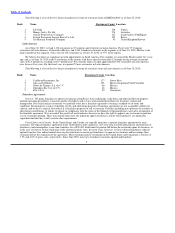
Franchise Restaurants. We grant franchises to operate restaurants using Burger King trademarks, trade dress and other
intellectual property, uniform operating procedures, consistent quality of products and services and standard procedures for inventory
control and management.
Our growth and success have been built, in significant part, upon our substantial franchise operations. We franchised our first
restaurant in 1961, and as of June 30, 2010, there were 6,562 franchise restaurants, owned by 738 franchise operators, in the United
States and Canada. We earned $314.6 million in franchise revenues in the United States and Canada in fiscal 2010, or 57% of our total
worldwide franchise revenues. Franchisees report gross sales on a monthly basis and pay royalties based on reported sales. The five
largest franchisees in the United States and Canada in terms of restaurant count represented in the aggregate approximately 16% of our
franchise restaurants in this segment as of June 30, 2010.
The following table details the top ten locations of our franchisees’ restaurants in the United States and Canada as of June 30,
2010:
% of Total U.S. and
Franchise Canada Franchise
Rank State/Province Restaurant Count Restaurants
1 California 670 10%
2 Texas 457 7%
3 Michigan 329 5%
4 New York 315 5%
5 Ohio 310 5%
6 Illinois 304 5%
7 Florida 294 4%
8 Pennsylvania 238 4%
9 Georgia 215 3%
10 New Jersey 185 3%
7