Burger King 2010 Annual Report Download - page 55
Download and view the complete annual report
Please find page 55 of the 2010 Burger King annual report below. You can navigate through the pages in the report by either clicking on the pages listed below, or by using the keyword search tool below to find specific information within the annual report.-
 1
1 -
2
-
3
-
4
-
5
-
6
-
7
-
8
-
9
-
10
-
11
-
12
-
13
-
14
-
15
-
16
-
17
-
18
-
19
-
20
-
21
-
22
-
23
-
24
-
25
-
26
-
27
-
28
-
29
-
30
-
31
-
32
-
33
-
34
-
35
-
36
-
37
-
38
-
39
-
40
-
41
-
42
-
43
-
44
-
 45
45 -
 46
46 -
 47
47 -
 48
48 -
 49
49 -
 50
50 -
 51
51 -
 52
52 -
 53
53 -
 54
54 -
 55
55 -
 56
56 -
 57
57 -
 58
58 -
 59
59 -
 60
60 -
 61
61 -
 62
62 -
 63
63 -
 64
64 -
 65
65 -
66
-
67
-
68
-
69
-
70
-
71
-
72
-
73
-
74
-
75
-
76
-
77
-
78
-
79
-
80
-
81
-
82
-
83
-
84
-
85
-
86
-
87
-
88
-
89
-
90
-
91
-
92
-
93
-
94
-
95
-
96
-
97
-
98
-
99
-
100
-
101
-
102
-
103
-
104
-
105
-
106
-
107
-
108
-
109
-
110
-
111
-
112
-
113
-
114
-
115
-
116
-
117
-
118
-
119
-
120
-
121
-
122
-
123
-
124
-
125
-
126
-
127
-
128
-
129
-
130
-
131
-
132
-
133
-
134
-
135
-
136
-
137
-
138
-
139
-
140
-
141
-
142
-
143
-
144
-
145
-
146
 |
 |

Table of Contents
of changes to our property portfolio in the U.S. & Canada segment, which includes the impact of refranchisings of Company restaurants
and opening new restaurants leased to franchisees. These factors were partially offset by decreased rent expense from a reduction in the
number of properties leased to franchisees in EMEA.
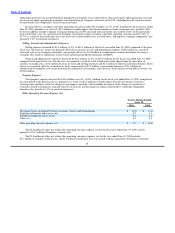
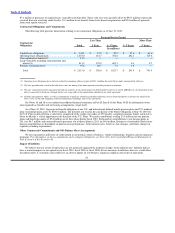
Other operating (income) expense, net
For the
Fiscal Years
Ended
June 30,
2010 2009
Net (gains) losses on disposal of assets restaurant closures and refranchisings $ (2.4) $ (8.5)
Litigation settlements and reserves, net (0.2) 0.2
Foreign exchange net (gains) losses (3.3) 8.4
Other, net 5.2 1.8
Other operating (income) expense, net $ (0.7) $ 1.9
The $5.2 million of other, net within other operating (income) expense, net for fiscal year ended June 30, 2010 includes a
$2.4 million charge related to consumption tax in EMEA, $1.5 million of severance costs related to refranchisings in Germany,
$1.0 million of franchise workout costs and a $0.7 million contract termination fee, partially offset by $1.1 million of income recorded
in connection with the expiration of gift cards in the U.S.
The $1.8 million of other, net within other operating (income) expense, net for the fiscal year ended June 30, 2009 consists
primarily of $1.7 million of franchise workout costs.
Income from Operations
For the
Fiscal Years
Ended
June 30,
2010 2009
Income from Operations:
United States and Canada $ 346.7 $ 345.7
EMEA/APAC 84.6 83.6
Latin America 38.2 37.8
Unallocated (136.6) (127.7)
Total income from operations $ 332.9 $ 339.4
Income from operations decreased by $6.5 million, or 2%, to $332.9 million during the fiscal year ended June 30, 2010, compared
to the prior fiscal year, primarily as a result of a decrease in Company restaurant margin of $12.3 million, a $1.5 million increase in
selling, general and administrative expenses and a reduction in net property revenue of $1.1 million, partially offset by a $5.8 million
increase in franchise revenues and a $2.6 million decrease in other operating expense, net. (See Note 23 to our audited consolidated
financial statements for segment information disclosures).
For the fiscal year ended June 30, 2010, the favorable impact on revenues from the movement of currency exchange rates was
partially offset by the unfavorable impact of currency exchange rates on Company restaurant expenses and selling, general and
administrative expenses, resulting in a net favorable impact on income from operations of $1.4 million.
In the U.S. and Canada, income from operations increased by $1.0 million, or 0.3%, to $346.7 million during the fiscal year ended
June 30, 2010, compared to the prior fiscal year, primarily as a result of a decrease in selling, general and administrative expenses of
$5.8 million, a decrease in other operating expense, net of $4.9 million and an increase in Company restaurant margin of $0.4 million.
These factors were partially offset by a
53