Burger King 2010 Annual Report Download - page 114
Download and view the complete annual report
Please find page 114 of the 2010 Burger King annual report below. You can navigate through the pages in the report by either clicking on the pages listed below, or by using the keyword search tool below to find specific information within the annual report.-
 1
1 -
2
-
3
-
4
-
5
-
6
-
7
-
8
-
9
-
10
-
11
-
12
-
13
-
14
-
15
-
16
-
17
-
18
-
19
-
20
-
21
-
22
-
23
-
24
-
25
-
26
-
27
-
28
-
29
-
30
-
31
-
32
-
33
-
34
-
35
-
36
-
37
-
38
-
39
-
40
-
41
-
42
-
43
-
44
-
45
-
46
-
47
-
48
-
49
-
50
-
51
-
52
-
53
-
54
-
55
-
56
-
57
-
58
-
59
-
60
-
61
-
62
-
63
-
64
-
65
-
66
-
67
-
68
-
69
-
70
-
71
-
72
-
73
-
74
-
75
-
76
-
77
-
78
-
79
-
80
-
81
-
82
-
83
-
84
-
85
-
86
-
87
-
88
-
89
-
90
-
91
-
92
-
93
-
94
-
95
-
96
-
97
-
98
-
99
-
100
-
101
-
102
-
103
-
 104
104 -
 105
105 -
 106
106 -
 107
107 -
 108
108 -
 109
109 -
 110
110 -
 111
111 -
 112
112 -
 113
113 -
 114
114 -
 115
115 -
 116
116 -
 117
117 -
 118
118 -
 119
119 -
 120
120 -
 121
121 -
 122
122 -
 123
123 -
 124
124 -
125
-
126
-
127
-
128
-
129
-
130
-
131
-
132
-
133
-
134
-
135
-
136
-
137
-
138
-
139
-
140
-
141
-
142
-
143
-
144
-
145
-
146
 |
 |

Table of Contents
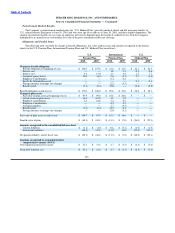
BURGER KING HOLDINGS, INC. AND SUBSIDIARIES
Notes to Consolidated Financial Statements — (Continued)
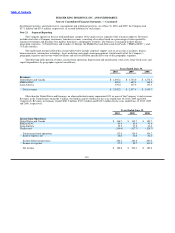
2010 2009 2008
Depreciation and Amortization:
United States and Canada $ 72.8 $ 63.4 $ 64.0
EMEA/APAC 18.0 15.7 14.1
Latin America 4.9 5.6 4.5
Unallocated 16.0 13.4 13.0
Total depreciation and amortization $ 111.7 $ 98.1 $ 95.6
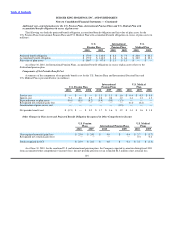
2010 2009
Assets:
United States and Canada $ 2,047.6 $ 2,004.3
EMEA/APAC 592.5 598.2
Latin America 66.8 59.5
Unallocated 40.3 45.1
Total assets $ 2,747.2 $ 2,707.1
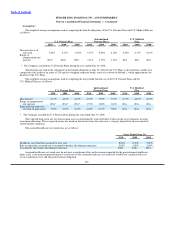
2010 2009
Long−Lived Assets:
United States and Canada $ 960.7 $ 945.0
EMEA/APAC 113.6 121.3
Latin America 38.0 37.1
Unallocated 40.3 45.1
Total long−lived assets $ 1,152.6 $ 1,148.5
Long−lived assets include property and equipment, net, and net investment in property leased to franchisees. Only the United
States represented 10% or more of the Company’s total long−lived assets as of June 30, 2010 and 2009. Long−lived assets in the United
States, including the unallocated portion, totaled $923.2 million and $917.1 million as of June 30, 2010 and 2009, respectively.
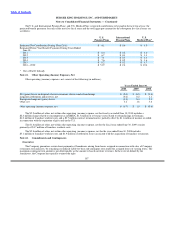
Years Ended June 30,
2010 2009 2008
Capital Expenditures:
United States and Canada $ 99.9 $ 146.9 $ 121.9
EMEA/APAC 30.9 30.7 28.6
Latin America 5.4 7.6 9.4
Unallocated 14.1 18.8 18.3
Total capital expenditures $ 150.3 $ 204.0 $ 178.2
The goodwill reflected in the Company’s consolidated balance sheets of $31.0 million and $26.4 million as of June 30, 2010 and
2009, respectively, was primarily attributable to the Company’s United States and Canada geographic segment.
111