Burger King 2010 Annual Report Download - page 89
Download and view the complete annual report
Please find page 89 of the 2010 Burger King annual report below. You can navigate through the pages in the report by either clicking on the pages listed below, or by using the keyword search tool below to find specific information within the annual report.-
 1
1 -
2
-
3
-
4
-
5
-
6
-
7
-
8
-
9
-
10
-
11
-
12
-
13
-
14
-
15
-
16
-
17
-
18
-
19
-
20
-
21
-
22
-
23
-
24
-
25
-
26
-
27
-
28
-
29
-
30
-
31
-
32
-
33
-
34
-
35
-
36
-
37
-
38
-
39
-
40
-
41
-
42
-
43
-
44
-
45
-
46
-
47
-
48
-
49
-
50
-
51
-
52
-
53
-
54
-
55
-
56
-
57
-
58
-
59
-
60
-
61
-
62
-
63
-
64
-
65
-
66
-
67
-
68
-
69
-
70
-
71
-
72
-
73
-
74
-
75
-
76
-
77
-
78
-
 79
79 -
 80
80 -
 81
81 -
 82
82 -
 83
83 -
 84
84 -
 85
85 -
 86
86 -
 87
87 -
 88
88 -
 89
89 -
 90
90 -
 91
91 -
 92
92 -
 93
93 -
 94
94 -
 95
95 -
 96
96 -
 97
97 -
 98
98 -
 99
99 -
100
-
101
-
102
-
103
-
104
-
105
-
106
-
107
-
108
-
109
-
110
-
111
-
112
-
113
-
114
-
115
-
116
-
117
-
118
-
119
-
120
-
121
-
122
-
123
-
124
-
125
-
126
-
127
-
128
-
129
-
130
-
131
-
132
-
133
-
134
-
135
-
136
-
137
-
138
-
139
-
140
-
141
-
142
-
143
-
144
-
145
-
146
 |
 |

Table of Contents
BURGER KING HOLDINGS, INC. AND SUBSIDIARIES
Notes to Consolidated Financial Statements — (Continued)
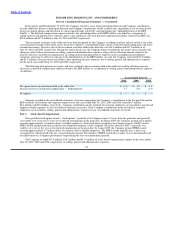
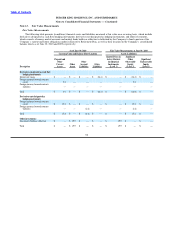
For the years ended June 30, 2010, 2009 and 2008, the fair value of shares withheld by the Company to meet employees’
minimum statutory withholding tax requirements on the settlement of RSU’s was $2.7 million, $0.3 million, and $4.1 million,
respectively.
Note 4. Acquisitions, Closures and Dispositions
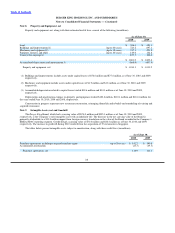
Acquisitions
Acquisitions are summarized as follows (in millions, except for number of restaurants):
Years Ended June 30,
2010 2009 2008
Number of restaurants acquired 39 87 83
Prepaids and other current assets $ 1.8 $ 1.0 $ 1.0
Property and equipment, net 4.9 14.6 13.3
Goodwill and other intangible assets 7.6 55.7 47.5
Other assets, net 2.1 — —
Assumed liabilities (2.4) (3.4) (7.6)
Total purchase price $ 14.0 $ 67.9 $ 54.2
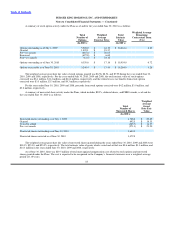
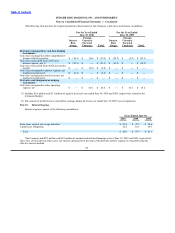
Closures and Dispositions
Gains and losses on closures and dispositions represent sales of Company properties and other costs related to restaurant closures
and sales of Company restaurants to franchisees, referred to as “refranchisings,” and are recorded in other operating (income) expenses,
net in the accompanying consolidated statements of income. Gains and losses recognized in the current period may reflect closures and
refranchisings that occurred in previous periods.
Closures and dispositions are summarized as follows (in millions, except for number of restaurants):
Years Ended June 30,
2010 2009 2008
Number of restaurant closures 34 19 29
Number of refranchisings 91 51 38
Net gain on restaurant closures, refranchisings and dispositions of assets $ (2.4) $ (8.5) $ (9.8)
Included in the net gain on restaurant closures, refranchisings and dispositions of assets for the years ended June 30, 2010 and
2009 is a $2.3 million and $5.4 million gain, respectively, from the refranchising of Company restaurants in the U.S. and Germany.
Included in the net gain on restaurant closures, refranchisings and dispositions of assets for the year ended June 30, 2008 is a
$9.0 million gain from the refranchising of Company restaurants, primarily in Germany.
86