Burger King 2010 Annual Report Download - page 50
Download and view the complete annual report
Please find page 50 of the 2010 Burger King annual report below. You can navigate through the pages in the report by either clicking on the pages listed below, or by using the keyword search tool below to find specific information within the annual report.-
 1
1 -
2
-
3
-
4
-
5
-
6
-
7
-
8
-
9
-
10
-
11
-
12
-
13
-
14
-
15
-
16
-
17
-
18
-
19
-
20
-
21
-
22
-
23
-
24
-
25
-
26
-
27
-
28
-
29
-
30
-
31
-
32
-
33
-
34
-
35
-
36
-
37
-
38
-
39
-
 40
40 -
 41
41 -
 42
42 -
 43
43 -
 44
44 -
 45
45 -
 46
46 -
 47
47 -
 48
48 -
 49
49 -
 50
50 -
 51
51 -
 52
52 -
 53
53 -
 54
54 -
 55
55 -
 56
56 -
 57
57 -
 58
58 -
 59
59 -
 60
60 -
61
-
62
-
63
-
64
-
65
-
66
-
67
-
68
-
69
-
70
-
71
-
72
-
73
-
74
-
75
-
76
-
77
-
78
-
79
-
80
-
81
-
82
-
83
-
84
-
85
-
86
-
87
-
88
-
89
-
90
-
91
-
92
-
93
-
94
-
95
-
96
-
97
-
98
-
99
-
100
-
101
-
102
-
103
-
104
-
105
-
106
-
107
-
108
-
109
-
110
-
111
-
112
-
113
-
114
-
115
-
116
-
117
-
118
-
119
-
120
-
121
-
122
-
123
-
124
-
125
-
126
-
127
-
128
-
129
-
130
-
131
-
132
-
133
-
134
-
135
-
136
-
137
-
138
-
139
-
140
-
141
-
142
-
143
-
144
-
145
-
146
 |
 |

Table of Contents
Our sales growth in the United States and Canada for the fiscal year ended June 30, 2009 reflects comparable sales growth and the
net increase in the number of restaurants. We had 7,534 restaurants in the United States and Canada as of June 30, 2009, compared to
7,512 restaurants as of June 30, 2008, reflecting a less than 1% increase in the number of restaurants.
EMEA/APAC demonstrated sales growth for the fiscal year ended June 30, 2010, reflecting openings of new restaurants and
positive comparable sales, primarily driven by Spain, Turkey and our major APAC markets, including Australia, New Zealand and
Korea. We had 3,487 restaurants in EMEA/APAC as of June 30, 2010, compared to 3,313 restaurants as of June 30, 2009, reflecting a
5% increase in the number of restaurants.
EMEA/APAC demonstrated sales growth for the fiscal year ended June 30, 2009, reflecting net openings of new restaurants and
comparable sales growth in most major markets with the exception of Germany, where adverse macroeconomic conditions have
resulted in negative comparable sales growth. We had 3,313 restaurants in EMEA/APAC as of June 30, 2009, compared to 3,051
restaurants as of June 30, 2008, a 9% increase in the number of restaurants.
Latin America experienced positive sales growth for the fiscal year ended June 30, 2010, reflecting openings of new restaurants,
partially offset by negative comparable sales growth, primarily driven by Mexico. We had 1,138 restaurants in Latin America as of
June 30, 2010, compared to 1,078 restaurants as of June 30, 2009, reflecting a 6% increase in the number of restaurants.
Latin America’s sales growth was driven by new restaurant openings and positive comparable sales for the fiscal year ended
June 30, 2009. We had 1,078 restaurants in Latin America as of June 30, 2009, compared to 1,002 restaurants as of June 30, 2008, an
8% increase in the number of restaurants.
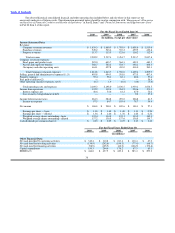
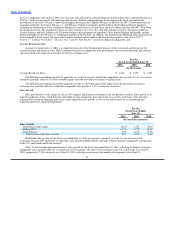
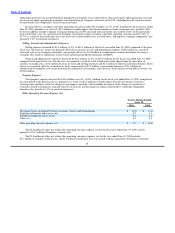
Results of Operations
The following table presents our results of operations for the periods indicated:
For the Fiscal Years Ended June 30,
2010 2009 2008
Increase/ Increase/
Amount Amount (Decrease) Amount (Decrease)
(In millions, except percentages)
Revenues:
Company restaurant revenues $ 1,839.3 $ 1,880.5 (2)% $ 1,795.9 5%
Franchise revenues 549.2 543.4 1% 537.2 1%
Property revenues 113.7 113.5 0% 121.6 (7)%
Total revenues 2,502.2 2,537.4 (1)% 2,454.7 3%
Company restaurant expenses 1,614.8 1,643.7 (2)% 1,538.0 7%
Selling, general and administrative expenses(1) 495.8 494.3 0% 501.0 (1)%
Property expenses 59.4 58.1 2% 62.1 (6)%
Other operating (income) expenses, net(1) (0.7) 1.9 NM (0.6) NM
Total operating costs and expenses 2,169.3 2,198.0 (1)% 2,100.5 5%
Income from operations 332.9 339.4 (2)% 354.2 (4)%
Interest expense, net 48.6 54.6 (11)% 61.2 (11)%
Income before income taxes 284.3 284.8 (0)% 293.0 (3)%
Income tax expense 97.5 84.7 15% 103.4 (18)%
Net income $ 186.8 $ 200.1 (7)% $ 189.6 6%
NM Not meaningful
48