Burger King 2010 Annual Report Download - page 109
Download and view the complete annual report
Please find page 109 of the 2010 Burger King annual report below. You can navigate through the pages in the report by either clicking on the pages listed below, or by using the keyword search tool below to find specific information within the annual report.-
 1
1 -
2
-
3
-
4
-
5
-
6
-
7
-
8
-
9
-
10
-
11
-
12
-
13
-
14
-
15
-
16
-
17
-
18
-
19
-
20
-
21
-
22
-
23
-
24
-
25
-
26
-
27
-
28
-
29
-
30
-
31
-
32
-
33
-
34
-
35
-
36
-
37
-
38
-
39
-
40
-
41
-
42
-
43
-
44
-
45
-
46
-
47
-
48
-
49
-
50
-
51
-
52
-
53
-
54
-
55
-
56
-
57
-
58
-
59
-
60
-
61
-
62
-
63
-
64
-
65
-
66
-
67
-
68
-
69
-
70
-
71
-
72
-
73
-
74
-
75
-
76
-
77
-
78
-
79
-
80
-
81
-
82
-
83
-
84
-
85
-
86
-
87
-
88
-
89
-
90
-
91
-
92
-
93
-
94
-
95
-
96
-
97
-
98
-
 99
99 -
 100
100 -
 101
101 -
 102
102 -
 103
103 -
 104
104 -
 105
105 -
 106
106 -
 107
107 -
 108
108 -
 109
109 -
 110
110 -
 111
111 -
 112
112 -
 113
113 -
 114
114 -
 115
115 -
 116
116 -
 117
117 -
 118
118 -
 119
119 -
120
-
121
-
122
-
123
-
124
-
125
-
126
-
127
-
128
-
129
-
130
-
131
-
132
-
133
-
134
-
135
-
136
-
137
-
138
-
139
-
140
-
141
-
142
-
143
-
144
-
145
-
146
 |
 |

Table of Contents
BURGER KING HOLDINGS, INC. AND SUBSIDIARIES
Notes to Consolidated Financial Statements — (Continued)
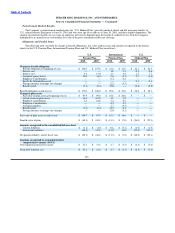
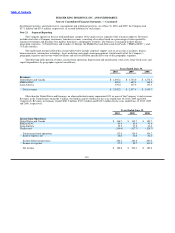
Plan Assets
The fair value of major category of pension plan assets for U.S. and International Pension Plans at June 30, 2010 is presented
below:
U.S. International
Pension Plan Pension Plans
2010 2010
Level 2:
Cash and Cash equivalents(a) $ 7.7 $ 0.3
Equity Securities(b):
U.S. 49.2 3.2
Non — U.S. 11.8 8.3
Fixed Income(b) :
Corporate Bonds and Notes 20.6 —
U.S. Government Treasuries 6.3 —
International Debt 4.9 —
Mortgage−Backed Securities 4.5 —
U.S. Government Agencies 1.9 —
Asset−Backed Securities 1.0 —
Municipal Bonds 0.8 —
Non− U.S. Bonds 0.2 6.2
Other(c ) 0.8 0.3
Total fair value of plan assets $ 109.7 $ 18.3
(a) Short−term investments in money market funds
(b) Securities held in common commingled trust funds
(c) Other securities held in common commingled trust funds including interest rate swaps and foreign currency contracts.
The Company categorizes plan assets within a three level fair value hierarchy as described in Note 2. Pooled funds are primarily
classified as Level 2 and are valued using net asset values of participation units held in common collective trusts, as reported by the
managers of the trusts and as supported by the unit prices of actual purchase and sale transactions. The fair value of plan assets for
U.S. Pension Plan and International Pension Plans as of June 30, 2009 was $97.9 million and $16.6 million, respectively.
The investment objective for the U.S. Pension Plans and International Pension Plans is to secure the benefit obligations to
participants while minimizing costs to the Company. The goal is to optimize the long−term return on plan assets at an average level of
risk. The portfolio of equity securities, currently targeted at 60% for U.S. Pension Plan and 70% for International Plan, includes
primarily large−capitalization companies with a mix of small−capitalization U.S. and foreign companies well diversified by industry.
The portfolio of fixed income asset allocation, currently targeted at 40% for U.S. Plan and 30% for International Plan, is actively
managed and consists of long duration fixed income securities primarily in U.S. debt markets and non — U.S. bonds with long−term
maturities that help to reduce exposure to interest variation and to better correlate asset maturities with obligations.
Estimated Future Cash Flows
Total contributions to the U.S. Pension Plans and International Pension Plans were $3.5 million, $25.7 million and $6.1 million for
the years ended June 30, 2010, 2009 and 2008, respectively.
106