Burger King 2010 Annual Report Download - page 96
Download and view the complete annual report
Please find page 96 of the 2010 Burger King annual report below. You can navigate through the pages in the report by either clicking on the pages listed below, or by using the keyword search tool below to find specific information within the annual report.-
 1
1 -
2
-
3
-
4
-
5
-
6
-
7
-
8
-
9
-
10
-
11
-
12
-
13
-
14
-
15
-
16
-
17
-
18
-
19
-
20
-
21
-
22
-
23
-
24
-
25
-
26
-
27
-
28
-
29
-
30
-
31
-
32
-
33
-
34
-
35
-
36
-
37
-
38
-
39
-
40
-
41
-
42
-
43
-
44
-
45
-
46
-
47
-
48
-
49
-
50
-
51
-
52
-
53
-
54
-
55
-
56
-
57
-
58
-
59
-
60
-
61
-
62
-
63
-
64
-
65
-
66
-
67
-
68
-
69
-
70
-
71
-
72
-
73
-
74
-
75
-
76
-
77
-
78
-
79
-
80
-
81
-
82
-
83
-
84
-
85
-
 86
86 -
 87
87 -
 88
88 -
 89
89 -
 90
90 -
 91
91 -
 92
92 -
 93
93 -
 94
94 -
 95
95 -
 96
96 -
 97
97 -
 98
98 -
 99
99 -
 100
100 -
 101
101 -
 102
102 -
 103
103 -
 104
104 -
 105
105 -
 106
106 -
107
-
108
-
109
-
110
-
111
-
112
-
113
-
114
-
115
-
116
-
117
-
118
-
119
-
120
-
121
-
122
-
123
-
124
-
125
-
126
-
127
-
128
-
129
-
130
-
131
-
132
-
133
-
134
-
135
-
136
-
137
-
138
-
139
-
140
-
141
-
142
-
143
-
144
-
145
-
146
 |
 |

Table of Contents
BURGER KING HOLDINGS, INC. AND SUBSIDIARIES
Notes to Consolidated Financial Statements — (Continued)
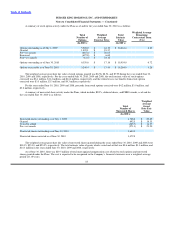
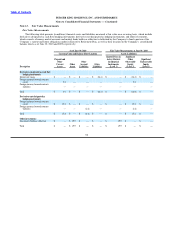
As of June 30, 2009 Fair Value Measurements at June 30, 2009
Carrying Value and Balance Sheet Location Assets (Liabilities)
Quoted Prices in Significant
Prepaid and Active Markets Other Significant
Other Other for Identical Observable Unobservable
Current Other Accrued Other Instruments Inputs Inputs
Description Assets Assets Liabilities Liabilities (Level 1) (Level 2) (Level 3)
Derivatives designated as cash flow
hedging instruments:
Interest rate swaps $ — $ — $ — $ (32.4) $ — $ (32.4) $ —
Total $ — $ — $ — $ (32.4) $ — $ (32.4) $ —
Derivatives not designated as
hedging instruments:
Foreign currency forward contracts
(asset) $ 0.3 $ — $ — $ — $ — $ 0.3 $ —
Foreign currency forward contracts
(liability) $ — $ — $ (20.3) $ — $ — $ (20.3) $ —
Total $ 0.3 $ — $ (20.3) $ — $ — $ (20.0) $ —
Other investments:
Investments held in a rabbi trust $ — $ 17.9 $ — $ — $ 17.9 $ — $ —
Total $ — $ 17.9 $ — $ — $ 17.9 $ — $ —
The Company’s derivatives are valued using a discounted cash flow analysis that incorporates observable market parameters, such
as interest rate yield curves and currency rates, classified as Level 2 within the valuation hierarchy. Derivative valuations incorporate
credit risk adjustments that are necessary to reflect the probability of default by the counterparty or the Company.
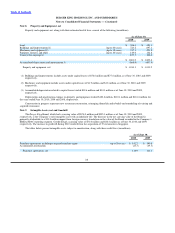
At June 30, 2010, the fair value of the Company’s variable rate term debt was estimated at $744.4 million, compared to a carrying
amount of $753.7 million. At June 30, 2009, the fair value of the Company’s variable rate term debt was estimated at $791.9 million,
compared to a carrying amount of $816.2 million. Refer to Note 2 for inputs used to estimate fair value.
Certain nonfinancial assets and liabilities are measured at fair value on a nonrecurring basis, that is these assets and liabilities are
not measured at fair value on an ongoing basis but are subject to periodic impairment tests. For the Company, these items primarily
include long− lived assets, goodwill and other intangible assets. Refer to Note 2 for inputs and valuation techniques used to measure fair
value of these nonfinancial assets. There was no impairment charge recorded for fiscal year ended June 30, 2010.
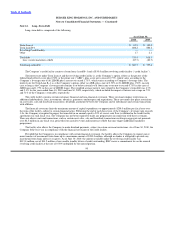
Note 14. Derivative Instruments
Disclosures about Derivative Instruments and Hedging Activities
The Company enters into derivative instruments for risk management purposes, including derivatives designated as hedging
instruments and those utilized as economic hedges. The Company uses derivatives to manage exposure to fluctuations in interest rates
and currency exchange rates. 93