Burger King 2010 Annual Report Download - page 8
Download and view the complete annual report
Please find page 8 of the 2010 Burger King annual report below. You can navigate through the pages in the report by either clicking on the pages listed below, or by using the keyword search tool below to find specific information within the annual report.-
 1
1 -
 2
2 -
 3
3 -
 4
4 -
 5
5 -
 6
6 -
 7
7 -
 8
8 -
 9
9 -
 10
10 -
 11
11 -
 12
12 -
 13
13 -
 14
14 -
 15
15 -
 16
16 -
 17
17 -
 18
18 -
 19
19 -
20
-
21
-
22
-
23
-
24
-
25
-
26
-
27
-
28
-
29
-
30
-
31
-
32
-
33
-
34
-
35
-
36
-
37
-
38
-
39
-
40
-
41
-
42
-
43
-
44
-
45
-
46
-
47
-
48
-
49
-
50
-
51
-
52
-
53
-
54
-
55
-
56
-
57
-
58
-
59
-
60
-
61
-
62
-
63
-
64
-
65
-
66
-
67
-
68
-
69
-
70
-
71
-
72
-
73
-
74
-
75
-
76
-
77
-
78
-
79
-
80
-
81
-
82
-
83
-
84
-
85
-
86
-
87
-
88
-
89
-
90
-
91
-
92
-
93
-
94
-
95
-
96
-
97
-
98
-
99
-
100
-
101
-
102
-
103
-
104
-
105
-
106
-
107
-
108
-
109
-
110
-
111
-
112
-
113
-
114
-
115
-
116
-
117
-
118
-
119
-
120
-
121
-
122
-
123
-
124
-
125
-
126
-
127
-
128
-
129
-
130
-
131
-
132
-
133
-
134
-
135
-
136
-
137
-
138
-
139
-
140
-
141
-
142
-
143
-
144
-
145
-
146
 |
 |

Table of Contents
integrated marketing campaigns utilizing social media that we believe will resonate with our core
consumer and expand our consumer base.
• Enhance restaurant margins and profitability: We remain committed to improving margins in our
Company and franchise restaurants and positioning our system−wide restaurant portfolio for long term
growth. We believe that we can drive restaurant profitability by:
• Achieving our comparable sales and average restaurant sales potential. We believe a component to
improving comparable sales and average restaurant sales is to enhance the guest experience. Our key
guest satisfaction and operations metrics showed continued improvement in fiscal 2010 and we intend
to continue to develop innovative approaches to improving these metrics. In addition, we believe that by
reducing the gap between our hours of operation and those of our competitors, we will increase
comparable sales and average restaurant sales in U.S. restaurants. As of June 30, 2010, 238 Company
restaurants in the United States were open 24 hours daily.
• Better utilizing our fixed cost base and exploring ways to mitigate labor, commodity and energy costs.
We are focused on leveraging our fixed cost structure by introducing higher margin products and
creating efficiencies through continued deployment of equipment and tools aimed at improving
restaurant level performance, such as our point of sale cash register systems which we believe will
reduce labor costs and waste. As of June 30, 2010, our POS systems had been installed in all of our
Company restaurants and in approximately 57% of franchise restaurants. In the kitchen, our
revolutionary flexible batch broiler maximizes cooking flexibility and facilitates a broader menu
selection while reducing energy costs. The flexible batch broiler is currently installed in 89% of our
Company restaurants, and the broiler has been ordered or installed in approximately 68% of franchise
restaurants.
• Use proactive portfolio management to drive growth: We intend to use proactive portfolio management
to drive growth and optimize our restaurant portfolio. As part of this ongoing strategy, we will focus on
(1) attracting new franchisees to acquire restaurants from existing franchisees, (2) acquiring restaurants
from our franchisees in strategic markets or for re−allocation to other franchisees that meet our strategic
objectives and (3) refranchising Company restaurants to new and existing franchisees to rationalize our
Company restaurant portfolio and provide new opportunities for franchisees. In fiscal 2010, we sold 37
Company restaurants in Germany and 54 restaurants in the U.S. and acquired 35 restaurants in Singapore.
We expect to continue our disciplined approach to portfolio management in an effort to optimize our
Company restaurant base, enhance development agreements with new and existing franchisees, reduce
concentration in certain markets and opportunistically enter new markets. As it relates to refranchisings,
within the next three to five years, we expect to refranchise up to half of our current Company restaurant
portfolio. We also expect to conclude our U.S. and Canada restaurant reimaging program within the next
two to three years on our reduced number of Company restaurants.
Global Operations
We operate in three reportable segments: (i) the United States and Canada; (ii) Europe, the Middle East, Africa and Asia Pacific,
or EMEA/APAC; and (iii) Latin America. Additional financial information about geographic segments is incorporated herein by
reference to Management’s Discussion and Analysis of Financial Condition and Results of Operations in Part II, Item 7 and Segment
Reporting in Part II, Item 8 in Note 23 of this Form 10−K. Our restaurants are limited−service restaurants of distinctive design and are
generally located in high−traffic areas. We believe our restaurants appeal to a broad spectrum of consumers, with multiple day parts
appealing to different customer groups.
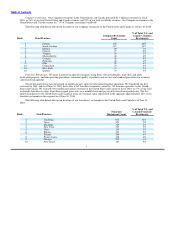
United States and Canada
United States and Canada
As of June 30, 2010, we had 987 Company restaurants and 6,562 franchise restaurants operating in the United States and Canada.
We increased our restaurant count in the United States and Canada by 15 restaurants during fiscal 2010.
6