Burger King 2010 Annual Report Download - page 42
Download and view the complete annual report
Please find page 42 of the 2010 Burger King annual report below. You can navigate through the pages in the report by either clicking on the pages listed below, or by using the keyword search tool below to find specific information within the annual report.-
 1
1 -
2
-
3
-
4
-
5
-
6
-
7
-
8
-
9
-
10
-
11
-
12
-
13
-
14
-
15
-
16
-
17
-
18
-
19
-
20
-
21
-
22
-
23
-
24
-
25
-
26
-
27
-
28
-
29
-
30
-
31
-
 32
32 -
 33
33 -
 34
34 -
 35
35 -
 36
36 -
 37
37 -
 38
38 -
 39
39 -
 40
40 -
 41
41 -
 42
42 -
 43
43 -
 44
44 -
 45
45 -
 46
46 -
 47
47 -
 48
48 -
 49
49 -
 50
50 -
 51
51 -
 52
52 -
53
-
54
-
55
-
56
-
57
-
58
-
59
-
60
-
61
-
62
-
63
-
64
-
65
-
66
-
67
-
68
-
69
-
70
-
71
-
72
-
73
-
74
-
75
-
76
-
77
-
78
-
79
-
80
-
81
-
82
-
83
-
84
-
85
-
86
-
87
-
88
-
89
-
90
-
91
-
92
-
93
-
94
-
95
-
96
-
97
-
98
-
99
-
100
-
101
-
102
-
103
-
104
-
105
-
106
-
107
-
108
-
109
-
110
-
111
-
112
-
113
-
114
-
115
-
116
-
117
-
118
-
119
-
120
-
121
-
122
-
123
-
124
-
125
-
126
-
127
-
128
-
129
-
130
-
131
-
132
-
133
-
134
-
135
-
136
-
137
-
138
-
139
-
140
-
141
-
142
-
143
-
144
-
145
-
146
 |
 |

Table of Contents
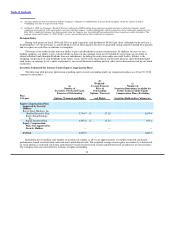
For the Fiscal Years Ended June 30,
2010 2009 2008
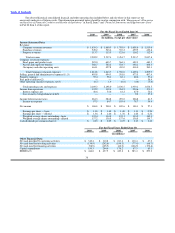
Franchise revenues (in millions)(11):
United States and Canada $ 314.6 $ 323.1 $ 317.9
EMEA/APAC(9) 186.2 173.4 173.0
Latin America(10) 48.4 46.9 46.3
Total franchise revenues $ 549.2 $ 543.4 $ 537.2
Income from operations (in millions):
United States and Canada $ 346.7 $ 345.7 $ 349.7
EMEA/APAC(9) 84.6 83.6 91.8
Latin America(10) 38.2 37.8 41.4
Unallocated(12) (136.6) (127.7) (128.7)
Total income from operations $ 332.9 $ 339.4 $ 354.2
(1) Selling, general and administrative expenses for fiscal 2006 includes compensation expense and taxes related to a $34.4 million compensatory make−whole
payment made on February 21, 2006 to holders of options and restricted stock unit awards, primarily members of senior management.
(2) Fees paid to affiliates consist of management fees we paid to the Sponsors under a management agreement. Fees paid to affiliates in fiscal 2006 also include a
$30.0 million fee that we paid to terminate the management agreement with the Sponsors.
(3) See Note 2 to the Consolidated Financial Statements in Part II, Item 8 of this Form 10− K for information about reclassification of the net (gains) losses
related to change in value of the investments held in a rabbi trust (the “rabbi trust”) from other operating (income) expenses, net to Selling, General and
Administrative expenses for the fiscal years ended June 30, 2009 and 2008. The net (gains) losses related to the change in value of these investments are fully
offset by the increase (decrease) in deferred compensation, in selling, general and administrative expenses in the accompanying consolidated statements of
income. For the fiscal years ended June 30, 2009 and 2008, we reclassified $3.9 million and $1.5 million of loss, respectively, from other operating (income)
expenses, net to Selling, General and Administrative expenses related to the reclassification.
(4) The cash dividend paid in fiscal 2006 represents a special dividend paid prior to our initial public offering.
(5) EBITDA is defined as earnings (net income) before interest, taxes, depreciation and amortization, and is used by management to measure operating
performance of the business. We also use EBITDA as a measure to calculate certain incentive based compensation and certain financial covenants related to
our credit facility and as a factor in our tangible and intangible asset impairment test. Management believes EBITDA is a useful measure of operating
performance.
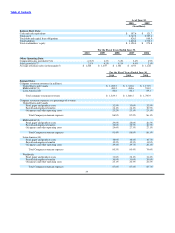
The following table is a reconciliation of our net income to EBITDA:
For the Fiscal Years Ended June 30,
2010 2009 2008 2007 2006
(In millions)
Net income $ 186.8 $ 200.1 $ 189.6 $ 148.1 $ 27.1
Interest expense, net 48.6 54.6 61.2 67.0 72.0
Loss on early extinguishment of debt — — — 0.8 17.8
Income tax expense 97.5 84.7 103.4 78.7 54.4
Depreciation and amortization 111.7 98.1 95.6 88.8 87.9
EBITDA $ 444.6 $ 437.5 $ 449.8 $ 383.4 $ 259.2
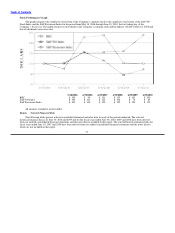
(6) Comparable sales growth and sales growth are analyzed on a constant currency basis, which means they are calculated using by translating current year
results at prior year average exchange rates, to remove the effects of currency fluctuations from these trend analyses. We believe these constant currency
measures provide a more meaningful analysis of our business by identifying the underlying business trends, without distortion from the effect of foreign
currency movements.
(7) Unless otherwise stated, comparable sales growth, sales growth and average restaurant sales are presented on a system−wide basis, which means they include
Company restaurants and franchise restaurants. Franchise sales represent sales at all franchise restaurants and are revenues to our franchisees. We do not
record franchise sales as revenues. However, our royalty revenues are calculated based on a percentage of franchise sales. See “Management’s Discussion
and Analysis of Financial Condition and Results of Operations — Key Business Measures.”
(8) Comparable sales growth refers to the change in restaurant sales in one period from a comparable period for restaurants that have been open for thirteen
months or longer.
(9) Refers to our operations in Europe, the Middle East, Africa and Asia Pacific.
40