Burger King 2010 Annual Report Download - page 113
Download and view the complete annual report
Please find page 113 of the 2010 Burger King annual report below. You can navigate through the pages in the report by either clicking on the pages listed below, or by using the keyword search tool below to find specific information within the annual report.-
 1
1 -
2
-
3
-
4
-
5
-
6
-
7
-
8
-
9
-
10
-
11
-
12
-
13
-
14
-
15
-
16
-
17
-
18
-
19
-
20
-
21
-
22
-
23
-
24
-
25
-
26
-
27
-
28
-
29
-
30
-
31
-
32
-
33
-
34
-
35
-
36
-
37
-
38
-
39
-
40
-
41
-
42
-
43
-
44
-
45
-
46
-
47
-
48
-
49
-
50
-
51
-
52
-
53
-
54
-
55
-
56
-
57
-
58
-
59
-
60
-
61
-
62
-
63
-
64
-
65
-
66
-
67
-
68
-
69
-
70
-
71
-
72
-
73
-
74
-
75
-
76
-
77
-
78
-
79
-
80
-
81
-
82
-
83
-
84
-
85
-
86
-
87
-
88
-
89
-
90
-
91
-
92
-
93
-
94
-
95
-
96
-
97
-
98
-
99
-
100
-
101
-
102
-
 103
103 -
 104
104 -
 105
105 -
 106
106 -
 107
107 -
 108
108 -
 109
109 -
 110
110 -
 111
111 -
 112
112 -
 113
113 -
 114
114 -
 115
115 -
 116
116 -
 117
117 -
 118
118 -
 119
119 -
 120
120 -
 121
121 -
 122
122 -
 123
123 -
124
-
125
-
126
-
127
-
128
-
129
-
130
-
131
-
132
-
133
-
134
-
135
-
136
-
137
-
138
-
139
-
140
-
141
-
142
-
143
-
144
-
145
-
146
 |
 |

Table of Contents
BURGER KING HOLDINGS, INC. AND SUBSIDIARIES
Notes to Consolidated Financial Statements — (Continued)
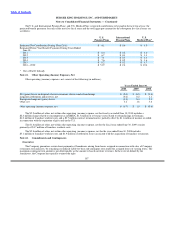
development patterns, and claim reserve, management and settlement practices. As of June 30, 2010 and 2009, the Company had
$37.1 million and $39.5 million, respectively, in accrued liabilities for such claims.
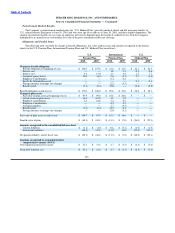
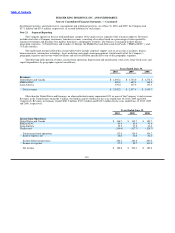
Note 23. Segment Reporting
The Company operates in the fast food hamburger category of the quick service segment of the restaurant industry. Revenues
include retail sales at Company restaurants, franchise revenues, consisting of royalties based on a percentage of sales reported by
franchise restaurants and franchise fees paid by franchisees, and property revenues. The business is managed in three distinct
geographic segments: (1) United States and Canada; (2) Europe, the Middle East and Africa and Asia Pacific (“EMEA/APAC”); and
(3) Latin America.
The unallocated amounts reflected in certain tables below include corporate support costs in areas such as facilities, finance,
human resources, information technology, legal, marketing and supply chain management, which benefit all of the Company’s
geographic segments and system−wide restaurants and are not allocated specifically to any of the geographic segments.
The following tables present revenues, income from operations, depreciation and amortization, total assets, long−lived assets and
capital expenditures by geographic segment (in millions):
Years Ended June 30,
2010 2009 2008
Revenues:
United States and Canada $ 1,695.2 $ 1,743.0 $ 1,578.5
EMEA/APAC 698.0 687.4 760.8
Latin America 109.0 107.0 115.4
Total revenues $ 2,502.2 $ 2,537.4 $ 2,454.7
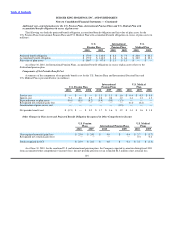
Other than the United States and Germany, no other individual country represented 10% or more of the Company’s total revenues.
Revenues in the United States totaled $1.5 billion, $1.6 billion and $1.4 billion for the years ended June 30, 2010, 2009 and 2008,
respectively. Revenues in Germany totaled $281.9 million, $307.2 million and $349.5 million for the years ended June 30, 2010, 2009
and 2008, respectively.
Years Ended June 30,
2010 2009 2008
Income from Operations:
United States and Canada $ 346.7 $ 345.7 $ 349.7
EMEA/APAC 84.6 83.6 91.8
Latin America 38.2 37.8 41.4
Unallocated (136.6) (127.7) (128.7)
Total income from operations 332.9 339.4 354.2
Interest expense, net 48.6 54.6 61.2
Income before income taxes 284.3 284.8 293.0
Income tax expense 97.5 84.7 103.4
Net income $ 186.8 $ 200.1 $ 189.6
110