Burger King 2010 Annual Report Download - page 106
Download and view the complete annual report
Please find page 106 of the 2010 Burger King annual report below. You can navigate through the pages in the report by either clicking on the pages listed below, or by using the keyword search tool below to find specific information within the annual report.-
 1
1 -
2
-
3
-
4
-
5
-
6
-
7
-
8
-
9
-
10
-
11
-
12
-
13
-
14
-
15
-
16
-
17
-
18
-
19
-
20
-
21
-
22
-
23
-
24
-
25
-
26
-
27
-
28
-
29
-
30
-
31
-
32
-
33
-
34
-
35
-
36
-
37
-
38
-
39
-
40
-
41
-
42
-
43
-
44
-
45
-
46
-
47
-
48
-
49
-
50
-
51
-
52
-
53
-
54
-
55
-
56
-
57
-
58
-
59
-
60
-
61
-
62
-
63
-
64
-
65
-
66
-
67
-
68
-
69
-
70
-
71
-
72
-
73
-
74
-
75
-
76
-
77
-
78
-
79
-
80
-
81
-
82
-
83
-
84
-
85
-
86
-
87
-
88
-
89
-
90
-
91
-
92
-
93
-
94
-
95
-
 96
96 -
 97
97 -
 98
98 -
 99
99 -
 100
100 -
 101
101 -
 102
102 -
 103
103 -
 104
104 -
 105
105 -
 106
106 -
 107
107 -
 108
108 -
 109
109 -
 110
110 -
 111
111 -
 112
112 -
 113
113 -
 114
114 -
 115
115 -
 116
116 -
117
-
118
-
119
-
120
-
121
-
122
-
123
-
124
-
125
-
126
-
127
-
128
-
129
-
130
-
131
-
132
-
133
-
134
-
135
-
136
-
137
-
138
-
139
-
140
-
141
-
142
-
143
-
144
-
145
-
146
 |
 |

Table of Contents
BURGER KING HOLDINGS, INC. AND SUBSIDIARIES
Notes to Consolidated Financial Statements — (Continued)
Postretirement Medical Benefits
The Company’s postretirement medical plan (the “U.S. Medical Plan”) provides medical, dental and life insurance benefits to
U.S. salaried retirees hired prior to June 30, 2001 and who were age 40 or older as of June 30, 2001, and their eligible dependents. The
amount of retirement health care coverage an employee will receive depends upon the length of credited service with the Company,
multiplied by an annual factor to determine the value of the post−retirement health care coverage.
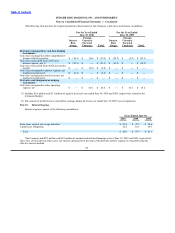
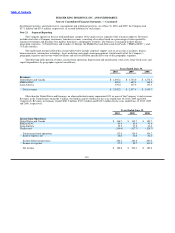
Obligations and Funded Status
The following table sets forth the change in benefit obligations, fair value of plan assets and amounts recognized in the balance
sheets for the U.S. Pension Plans, International Pension Plans and U.S. Medical Plan (in millions):
U.S. International U.S.
Pension Plan Pension Plans Medical Plan
2010 2009 2010 2009 2010 2009
Change in benefit obligation
Benefit obligation at beginning of year $ 146.0 $ 147.8 $ 23.6 $ 27.0 $ 22.1 $ 22.3
Service cost — — 1.8 2.1 0.4 0.6
Interest cost 9.1 11.0 1.3 1.6 1.3 1.7
Actuarial (gains) losses 29.0 (6.4) 5.6 (3.3) 2.7 (1.8)
Employee Contributions — — 0.2 0.3 — —
Part D Rx Subsidy Received — — — — 0.1 0.1
Foreign currency exchange rate changes — — (2.3) (4.1) — —
Benefits paid (5.1) (6.4) (0.6) — (0.6) (0.8)
Benefit obligation at end of year $ 179.0 $ 146.0 $ 29.6 $ 23.6 $ 26.0 $ 22.1
Change in plan assets
Fair value of plan assets at beginning of year $ 97.9 $ 99.0 $ 16.6 $ 20.8 $ — $ —
Actual return on plan assets 14.6 (19.5) 1.1 1.2 — —
Employer contributions 2.3 24.8 1.2 0.9 — —
Employee Contributions — — 0.2 0.3 — —
Actuarial gain/loss — — 1.7 (3.5) — —
Benefits paid (5.1) (6.4) (0.5) 0.1 — —
Foreign currency exchange rate changes — — (2.0) (3.2) — —
Fair value of plan assets at end of year $ 109.7 $ 97.9 $ 18.3 $ 16.6 $ — $ —
Funded status of plan $ (69.3) $ (48.1) $ (11.3) $ (7.0) $ (26.0) $ (22.1)
Amounts recognized in the consolidated balance sheet
Current liabilities $ (1.1) $ (1.0) $ (0.1) $ (0.1) $ (1.0) $ (1.0)
Noncurrent liabilities (68.2) (47.1) (11.2) (6.9) (25.0) (21.1)
Net pension liability, end of fiscal year $ (69.3) $ (48.1) $ (11.3) $ (7.0) $ (26.0) $ (22.1)
Amounts recognized in accumulated other
comprehensive income (AOCI)
Unrecognized actuarial loss (gain) $ 55.1 $ 31.2 $ 2.7 $ (1.3) $ (2.3) $ (5.4)
Total AOCI (before tax) $ 55.1 $ 31.2 $ 2.7 $ (1.3) $ (2.3) $ (5.4)
103