Burger King 2010 Annual Report Download - page 110
Download and view the complete annual report
Please find page 110 of the 2010 Burger King annual report below. You can navigate through the pages in the report by either clicking on the pages listed below, or by using the keyword search tool below to find specific information within the annual report.-
 1
1 -
2
-
3
-
4
-
5
-
6
-
7
-
8
-
9
-
10
-
11
-
12
-
13
-
14
-
15
-
16
-
17
-
18
-
19
-
20
-
21
-
22
-
23
-
24
-
25
-
26
-
27
-
28
-
29
-
30
-
31
-
32
-
33
-
34
-
35
-
36
-
37
-
38
-
39
-
40
-
41
-
42
-
43
-
44
-
45
-
46
-
47
-
48
-
49
-
50
-
51
-
52
-
53
-
54
-
55
-
56
-
57
-
58
-
59
-
60
-
61
-
62
-
63
-
64
-
65
-
66
-
67
-
68
-
69
-
70
-
71
-
72
-
73
-
74
-
75
-
76
-
77
-
78
-
79
-
80
-
81
-
82
-
83
-
84
-
85
-
86
-
87
-
88
-
89
-
90
-
91
-
92
-
93
-
94
-
95
-
96
-
97
-
98
-
99
-
 100
100 -
 101
101 -
 102
102 -
 103
103 -
 104
104 -
 105
105 -
 106
106 -
 107
107 -
 108
108 -
 109
109 -
 110
110 -
 111
111 -
 112
112 -
 113
113 -
 114
114 -
 115
115 -
 116
116 -
 117
117 -
 118
118 -
 119
119 -
 120
120 -
121
-
122
-
123
-
124
-
125
-
126
-
127
-
128
-
129
-
130
-
131
-
132
-
133
-
134
-
135
-
136
-
137
-
138
-
139
-
140
-
141
-
142
-
143
-
144
-
145
-
146
 |
 |

Table of Contents
BURGER KING HOLDINGS, INC. AND SUBSIDIARIES
Notes to Consolidated Financial Statements — (Continued)
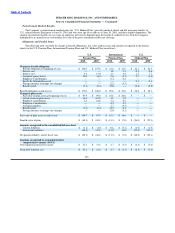
The U.S. and International Pension Plans’ and U.S. Medical Plan’s expected contributions to be paid in the next fiscal year, the
projected benefit payments for each of the next five fiscal years and the total aggregate amount for the subsequent five fiscal years are
as follows:
U.S. International U.S.
Pension Plans Pension Plans Medical Plan*
Estimated Net Contributions During Fiscal 2011: $ 6.1 $ 0.6 $ 1.0
Estimated Future Year Benefit Payments During Years Ended
June 30,:
2011 $ 6.4 $ 0.2 $ 1.0
2012 $ 6.7 $ 0.3 $ 1.3
2013 $ 7.1 $ 0.3 $ 1.4
2014 $ 7.6 $ 0.2 $ 1.6
2015 $ 8.2 $ 0.2 $ 1.7
2016 − 2020 $ 51.9 $ 2.4 $ 10.4
* Net of Part D Subsidy
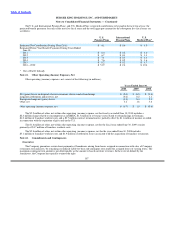
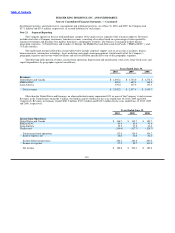
Note 21. Other Operating (Income) Expenses, Net
Other operating (income) expenses, net, consist of the following (in millions):
Years Ended June 30,
2010 2009 2008
Net (gains) losses on disposal of assets restaurant closures and refranchisings $ (2.4) $ (8.5) $ (9.8)
Litigation settlements and reserves, net (0.2) 0.2 1.1
Foreign exchange net (gains) losses (3.3) 8.4 2.3
Other, net 5.2 1.8 5.8
Other operating (income) expense, net $ (0.7) $ 1.9 $ (0.6)
The $5.2 million of other, net within other operating (income) expense, net for fiscal year ended June 30, 2010 includes a
$2.4 million charge related to consumption tax in EMEA, $1.5 million of severance costs related to refranchisings in Germany,
$1.0 million of franchise workout costs and a $0.7 million contract termination fee, partially offset by $1.1 million of income recorded
in connection with the expiration of gift cards in the U.S.
The $1.8 million of other, net within other operating (income) expense, net for the fiscal year ended June 30, 2009 consists
primarily of $1.7 million of franchise workout costs.
The $5.8 million of other, net within other operating (income) expenses, net for the year ended June 30, 2008 includes
$3.1 million of franchise workout costs and $1.9 million of settlement losses associated with the acquisition of franchise restaurants.
Note 22. Commitments and Contingencies
Guarantees
The Company guarantees certain lease payments of franchisees arising from leases assigned in connection with sales of Company
restaurants to franchisees, by remaining secondarily liable for base and contingent rents under the assigned leases of varying terms. The
maximum contingent rent amount is not determinable as the amount is based on future revenues. In the event of default by the
franchisees, the Company has typically retained the right
107