Burger King 2010 Annual Report Download - page 43
Download and view the complete annual report
Please find page 43 of the 2010 Burger King annual report below. You can navigate through the pages in the report by either clicking on the pages listed below, or by using the keyword search tool below to find specific information within the annual report.-
 1
1 -
2
-
3
-
4
-
5
-
6
-
7
-
8
-
9
-
10
-
11
-
12
-
13
-
14
-
15
-
16
-
17
-
18
-
19
-
20
-
21
-
22
-
23
-
24
-
25
-
26
-
27
-
28
-
29
-
30
-
31
-
32
-
 33
33 -
 34
34 -
 35
35 -
 36
36 -
 37
37 -
 38
38 -
 39
39 -
 40
40 -
 41
41 -
 42
42 -
 43
43 -
 44
44 -
 45
45 -
 46
46 -
 47
47 -
 48
48 -
 49
49 -
 50
50 -
 51
51 -
 52
52 -
 53
53 -
54
-
55
-
56
-
57
-
58
-
59
-
60
-
61
-
62
-
63
-
64
-
65
-
66
-
67
-
68
-
69
-
70
-
71
-
72
-
73
-
74
-
75
-
76
-
77
-
78
-
79
-
80
-
81
-
82
-
83
-
84
-
85
-
86
-
87
-
88
-
89
-
90
-
91
-
92
-
93
-
94
-
95
-
96
-
97
-
98
-
99
-
100
-
101
-
102
-
103
-
104
-
105
-
106
-
107
-
108
-
109
-
110
-
111
-
112
-
113
-
114
-
115
-
116
-
117
-
118
-
119
-
120
-
121
-
122
-
123
-
124
-
125
-
126
-
127
-
128
-
129
-
130
-
131
-
132
-
133
-
134
-
135
-
136
-
137
-
138
-
139
-
140
-
141
-
142
-
143
-
144
-
145
-
146
 |
 |

Table of Contents
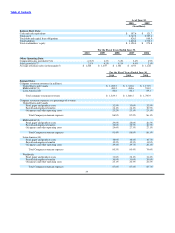
(10) Refers to our operations in Mexico, Central and South America, the Caribbean and Puerto Rico.
(11) Franchise revenues consist primarily of royalties paid by franchisees. Royalties earned are based on a percentage of franchise sales, which were
$13.1 billion, $12.8 billion and $12.9 billion for fiscal 2010, 2009, and 2008, respectively. Franchise sales are sales at all franchise restaurants and are
revenues to our franchisees. We do not record franchise sales as revenues.
(12) Unallocated includes corporate support costs in areas such as facilities, finance, human resources, information technology, legal, marketing, and supply
chain management, which benefit all of the Company’s geographic segments and system−wide restaurants and are not allocated specifically to any of the
geographic segments.
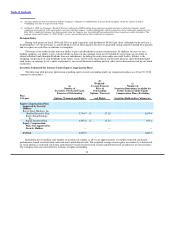
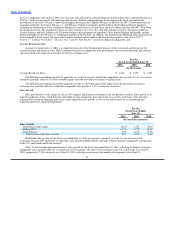
Burger King Holdings, Inc. and Subsidiaries Restaurant Count
The following table presents information relating to the analysis of our restaurant count for the geographic areas and periods
indicated.
As of June 30, Increase/
2010 2009 (Decrease)
(Unaudited)
Number of Company restaurants:
U.S. & Canada 987 1,043 (56)
EMEA/APAC 303 294 9
Latin America 97 92 5
Total Company restaurants 1,387 1,429 (42)
Number of franchise restaurants:
U.S. & Canada 6,562 6,491 71
EMEA/APAC 3,184 3,019 165
Latin America 1,041 986 55
Total franchise restaurants 10,787 10,496 291
Number of system−wide restaurants:
U.S. & Canada 7,549 7,534 15
EMEA/APAC 3,487 3,313 174
Latin America 1,138 1,078 60
Total system−wide restaurants 12,174 11,925 249
Item 7. Management’s Discussion and Analysis of Financial Condition and Results of Operations
You should read the following discussion together with Part II, Item 6 “Selected Financial Data” and our audited consolidated
financial statements and the related notes thereto included in Item 8 “Financial Statements and Supplementary Data.” In addition to
historical consolidated financial information, this discussion contains forward−looking statements that reflect our plans, estimates and
beliefs. Actual results could differ from these expectations as a result of factors including those described under Item 1A, “Risk
Factors,” “Special Note Regarding Forward−Looking Statements” and elsewhere in this Form 10−K.
References to fiscal 2011, fiscal 2010, fiscal 2009 and fiscal 2008 in this section are to our fiscal year ending June 30, 2011 and
our fiscal years ended June 30, 2010, 2009 and 2008, respectively. Unless otherwise stated, comparable sales growth, average
restaurant sales and sales growth are presented on a system−wide basis, which means that these measures include sales at both
Company restaurants and franchise restaurants. Franchise sales represent sales at all franchise restaurants and are revenues to our
franchisees. We do not record franchise sales as revenues; however, our franchise revenues include royalties based on franchise sales.
System−wide results are driven primarily by our franchise restaurants, as approximately 90% of our current system−wide restaurants
are franchised.
41