Berkshire Hathaway 2010 Annual Report Download - page 97
Download and view the complete annual report
Please find page 97 of the 2010 Berkshire Hathaway annual report below. You can navigate through the pages in the report by either clicking on the pages listed below, or by using the keyword search tool below to find specific information within the annual report.-
 1
1 -
2
-
3
-
4
-
5
-
6
-
7
-
8
-
9
-
10
-
11
-
12
-
13
-
14
-
15
-
16
-
17
-
18
-
19
-
20
-
21
-
22
-
23
-
24
-
25
-
26
-
27
-
28
-
29
-
30
-
31
-
32
-
33
-
34
-
35
-
36
-
37
-
38
-
39
-
40
-
41
-
42
-
43
-
44
-
45
-
46
-
47
-
48
-
49
-
50
-
51
-
52
-
53
-
54
-
55
-
56
-
57
-
58
-
59
-
60
-
61
-
62
-
63
-
64
-
65
-
66
-
67
-
68
-
69
-
70
-
71
-
72
-
73
-
74
-
75
-
76
-
77
-
78
-
79
-
80
-
81
-
82
-
83
-
84
-
85
-
86
-
 87
87 -
 88
88 -
 89
89 -
 90
90 -
 91
91 -
 92
92 -
 93
93 -
 94
94 -
 95
95 -
 96
96 -
 97
97 -
 98
98 -
 99
99 -
 100
100 -
 101
101 -
 102
102 -
 103
103 -
 104
104 -
 105
105 -
 106
106 -
 107
107 -
108
-
109
-
110
 |
 |

Management’s Discussion (Continued)
Equity Price Risk (Continued)
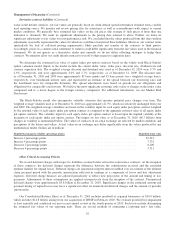
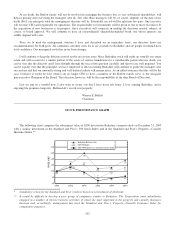
The following table summarizes our equity investments and derivative contract liabilities with equity price risk as of
December 31, 2010 and 2009. The effects of a hypothetical 30% increase and a 30% decrease in market prices as of those dates
is also shown. The selected 30% hypothetical change does not reflect what could be considered the best or worst case scenarios.
Indeed, results could be far worse due both to the nature of equity markets and the aforementioned concentrations existing in
our equity investment portfolio. Dollar amounts are in millions.
Fair Value
Hypothetical
Price Change
Estimated
Fair Value after
Hypothetical
Change in Prices
Hypothetical
Percentage
Increase (Decrease) in
Shareholders’ Equity
December 31, 2010
Equity securities ................................ $61,513 30% increase $ 79,967 7.6
30% decrease 43,059 (7.6)
Other investments (1) ............................. 8,668 30% increase 11,260 1.1
30% decrease 5,956 (1.1)
Equity index put option contracts ................... (6,712) 30% increase (4,687) 0.8
30% decrease (9,859) (1.3)
December 31, 2009
Equity securities ................................ $59,034 30% increase $ 76,744 8.7
30% decrease 41,324 (8.7)
Other investments (1) ............................. 8,011 30% increase 10,696 1.3
30% decrease 5,743 (1.1)
Equity index put option contracts ................... (7,309) 30% increase (5,291) 1.0
30% decrease (10,428) (1.5)
(1) Includes other investments that possess significant equity price risk. Excludes investments accounted for under the equity
method.
Foreign Currency Risk
We generally do not use derivative contracts to hedge foreign currency price changes primarily because of the natural
hedging that occurs between assets and liabilities denominated in foreign currencies in the Consolidated Financial Statements.
Financial statements of subsidiaries that do not use the U.S. Dollar as their functional currency are translated into U.S. Dollars
using period-end exchange rates for assets and liabilities and weighted-average exchange rates for revenues and expenses.
Adjustments resulting from translating the financial statements of these subsidiaries are reported in accumulated other
comprehensive income. Foreign currency transaction gains or losses are included in earnings primarily as a result of the
translation of foreign currency denominated assets and liabilities held by our U.S. subsidiaries. In addition, we hold investments
in major multinational companies that have significant foreign business and foreign currency risk of their own, such as The
Coca-Cola Company.
Our net assets subject to translation are primarily in our insurance and utilities and energy businesses, and to a lesser extent
in our manufacturing and services businesses. The translation impact is somewhat offset by transaction gains or losses on net
reinsurance liabilities of certain U.S. subsidiaries that are denominated in foreign currencies as well as the equity index put
option liabilities of U.S. subsidiaries relating to contracts that would be settled in foreign currencies.
Commodity Price Risk
Through our ownership of MidAmerican, we are subject to commodity price risk. Exposures include variations in the price
of fuel to generate electricity, wholesale electricity that is purchased and sold and natural gas supply for customers. Commodity
prices are subject to wide price swings as supply and demand are impacted by, among many other unpredictable items, weather,
market liquidity, generating facility availability, customer usage, storage and transmission and transportation constraints. To
mitigate a portion of the risk, MidAmerican uses derivative instruments, including forwards, futures, options, swaps and other
agreements, to effectively secure future supply or sell future production generally at fixed prices. The settled cost of these
contracts is generally recovered from customers in regulated rates. Accordingly, net unrealized gains and losses associated with
interim price movements on such contracts are recorded as regulatory assets or liabilities. Financial results would be negatively
95