Berkshire Hathaway 2010 Annual Report Download - page 50
Download and view the complete annual report
Please find page 50 of the 2010 Berkshire Hathaway annual report below. You can navigate through the pages in the report by either clicking on the pages listed below, or by using the keyword search tool below to find specific information within the annual report.-
 1
1 -
2
-
3
-
4
-
5
-
6
-
7
-
8
-
9
-
10
-
11
-
12
-
13
-
14
-
15
-
16
-
17
-
18
-
19
-
20
-
21
-
22
-
23
-
24
-
25
-
26
-
27
-
28
-
29
-
30
-
31
-
32
-
33
-
34
-
35
-
36
-
37
-
38
-
39
-
 40
40 -
 41
41 -
 42
42 -
 43
43 -
 44
44 -
 45
45 -
 46
46 -
 47
47 -
 48
48 -
 49
49 -
 50
50 -
 51
51 -
 52
52 -
 53
53 -
 54
54 -
 55
55 -
 56
56 -
 57
57 -
 58
58 -
 59
59 -
 60
60 -
61
-
62
-
63
-
64
-
65
-
66
-
67
-
68
-
69
-
70
-
71
-
72
-
73
-
74
-
75
-
76
-
77
-
78
-
79
-
80
-
81
-
82
-
83
-
84
-
85
-
86
-
87
-
88
-
89
-
90
-
91
-
92
-
93
-
94
-
95
-
96
-
97
-
98
-
99
-
100
-
101
-
102
-
103
-
104
-
105
-
106
-
107
-
108
-
109
-
110
 |
 |

Notes to Consolidated Financial Statements (Continued)
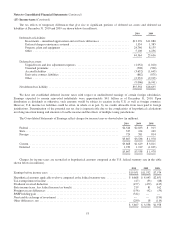
(11) Derivative contracts
Derivative contracts are used primarily by our finance and financial products businesses and our railroad, utilities and
energy businesses. As of December 31, 2010 and 2009, substantially all of the derivative contracts of our finance and financial
products businesses are not designated as hedges for financial reporting purposes. These contracts were initially entered into
with the expectation that the premiums received would exceed the amounts ultimately paid to counterparties. Changes in the fair
values of such contracts are reported in earnings as derivative gains/losses. A summary of derivative contracts of our finance
and financial products businesses follows (in millions).
2010 2009
Assets (3) Liabilities
Notional
Value Assets (3) Liabilities
Notional
Value
Equity index put options ................................. $— $6,712 $33,891(1) $ — $7,309 $37,990(1)
Credit default obligations:
High yield indexes ................................. — 159 4,893(2) — 781 5,533(2)
States/municipalities ................................ — 1,164 16,042(2) — 853 16,042(2)
Individual corporate ................................ 84 — 3,565(2) 81 — 3,565(2)
Other ................................................ 341 375 378 360
Counterparty netting .................................... (82) (39) (193) (34)
$343 $8,371 $ 266 $9,269
(1) Represents the aggregate undiscounted amount payable at the contract expiration dates assuming that the value of each
index is zero at the contract expiration date.
(2) Represents the maximum undiscounted future value of losses payable under the contracts. The number of losses required to
exhaust contract limits under substantially all of the contracts is dependent on the loss recovery rate related to the specific
obligor at the time of a default.
(3) Included in Other assets of finance and financial products businesses.
A summary of derivative gains/losses of our finance and financial products businesses included in the Consolidated
Statements of Earnings are as follows (in millions).
2010 2009 2008
Equity index put options ............................................................. $172 $2,713 $(5,028)
Credit default obligations ............................................................ 250 789 (1,774)
Other ............................................................................ (161) 122 (19)
$ 261 $3,624 $(6,821)
The equity index put option contracts are European style options written on four major equity indexes. Future payments, if
any, under these contracts will be required if the underlying index value is below the strike price at the contract expiration dates
which occur between June 2018 and January 2026. We received the premiums on these contracts in full at the contract inception
dates and therefore we have no counterparty credit risk. During the fourth quarter of 2010, certain of these contracts were
unwound at the instigation of our counterparty to these contracts. We had originally received premiums of $647 million for
these contracts and we paid $425 million to unwind the contracts. The notional value of these contracts was approximately
$4.3 billion.
At December 31, 2010, the aggregate intrinsic value (the undiscounted liability assuming the contracts are settled on their
future expiration dates based on the December 31, 2010 index values and foreign currency exchange rates) was approximately
$3.8 billion. However, these contracts may not be unilaterally terminated or fully settled before the expiration dates and
therefore the ultimate amount of cash basis gains or losses on these contracts may not be determined for many years. The
remaining weighted average life of all contracts was approximately 10 years at December 31, 2010.
Our credit default contracts pertain to various indexes of non-investment grade (or “high yield”) corporate issuers, state/
municipal debt issuers and other individual corporate issuers. These contracts cover the loss in value of specified debt
obligations of the issuers arising from default events, which are usually from their failure to make payments or bankruptcy. Loss
amounts are subject to aggregate contract limits.
48