Berkshire Hathaway 2010 Annual Report Download - page 8
Download and view the complete annual report
Please find page 8 of the 2010 Berkshire Hathaway annual report below. You can navigate through the pages in the report by either clicking on the pages listed below, or by using the keyword search tool below to find specific information within the annual report.-
 1
1 -
 2
2 -
 3
3 -
 4
4 -
 5
5 -
 6
6 -
 7
7 -
 8
8 -
 9
9 -
 10
10 -
 11
11 -
 12
12 -
 13
13 -
 14
14 -
 15
15 -
 16
16 -
 17
17 -
 18
18 -
 19
19 -
20
-
21
-
22
-
23
-
24
-
25
-
26
-
27
-
28
-
29
-
30
-
31
-
32
-
33
-
34
-
35
-
36
-
37
-
38
-
39
-
40
-
41
-
42
-
43
-
44
-
45
-
46
-
47
-
48
-
49
-
50
-
51
-
52
-
53
-
54
-
55
-
56
-
57
-
58
-
59
-
60
-
61
-
62
-
63
-
64
-
65
-
66
-
67
-
68
-
69
-
70
-
71
-
72
-
73
-
74
-
75
-
76
-
77
-
78
-
79
-
80
-
81
-
82
-
83
-
84
-
85
-
86
-
87
-
88
-
89
-
90
-
91
-
92
-
93
-
94
-
95
-
96
-
97
-
98
-
99
-
100
-
101
-
102
-
103
-
104
-
105
-
106
-
107
-
108
-
109
-
110
 |
 |

Intrinsic Value – Today and Tomorrow
Though Berkshire’s intrinsic value cannot be precisely calculated, two of its three key pillars can be
measured. Charlie and I rely heavily on these measurements when we make our own estimates of Berkshire’s
value.
The first component of value is our investments: stocks, bonds and cash equivalents. At yearend these
totaled $158 billion at market value.
Insurance float – money we temporarily hold in our insurance operations that does not belong to us –
funds $66 billion of our investments. This float is “free” as long as insurance underwriting breaks even, meaning
that the premiums we receive equal the losses and expenses we incur. Of course, underwriting results are volatile,
swinging erratically between profits and losses. Over our entire history, though, we’ve been significantly
profitable, and I also expect us to average breakeven results or better in the future. If we do that, all of our
investments – those funded both by float and by retained earnings – can be viewed as an element of value for
Berkshire shareholders.
Berkshire’s second component of value is earnings that come from sources other than investments and
insurance underwriting. These earnings are delivered by our 68 non-insurance companies, itemized on page 106.
In Berkshire’s early years, we focused on the investment side. During the past two decades, however, we’ve
increasingly emphasized the development of earnings from non-insurance businesses, a practice that will
continue.
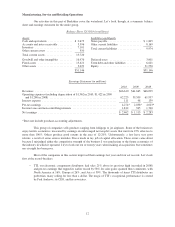
The following tables illustrate this shift. In the first table, we present per-share investments at decade
intervals beginning in 1970, three years after we entered the insurance business. We exclude those investments
applicable to minority interests.
Yearend
Per-Share
Investments Period
Compounded Annual Increase
in Per-Share Investments
1970 ................... $ 66
1980 ................... 754 1970-1980 27.5%
1990 ................... 7,798 1980-1990 26.3%
2000 ................... 50,229 1990-2000 20.5%
2010 ................... 94,730 2000-2010 6.6%
Though our compounded annual increase in per-share investments was a healthy 19.9% over the
40-year period, our rate of increase has slowed sharply as we have focused on using funds to buy operating
businesses.
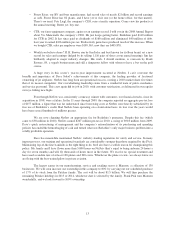
The payoff from this shift is shown in the following table, which illustrates how earnings of our
non-insurance businesses have increased, again on a per-share basis and after applicable minority interests.
Year
Per-Share
Pre-Tax Earnings Period
Compounded Annual Increase in
Per-Share Pre-Tax Earnings
1970 ............ $ 2.87
1980 ............ 19.01 1970-1980 20.8%
1990 ............ 102.58 1980-1990 18.4%
2000 ............ 918.66 1990-2000 24.5%
2010 ............ 5,926.04 2000-2010 20.5%
6