Berkshire Hathaway 2010 Annual Report Download - page 82
Download and view the complete annual report
Please find page 82 of the 2010 Berkshire Hathaway annual report below. You can navigate through the pages in the report by either clicking on the pages listed below, or by using the keyword search tool below to find specific information within the annual report.-
 1
1 -
2
-
3
-
4
-
5
-
6
-
7
-
8
-
9
-
10
-
11
-
12
-
13
-
14
-
15
-
16
-
17
-
18
-
19
-
20
-
21
-
22
-
23
-
24
-
25
-
26
-
27
-
28
-
29
-
30
-
31
-
32
-
33
-
34
-
35
-
36
-
37
-
38
-
39
-
40
-
41
-
42
-
43
-
44
-
45
-
46
-
47
-
48
-
49
-
50
-
51
-
52
-
53
-
54
-
55
-
56
-
57
-
58
-
59
-
60
-
61
-
62
-
63
-
64
-
65
-
66
-
67
-
68
-
69
-
70
-
71
-
 72
72 -
 73
73 -
 74
74 -
 75
75 -
 76
76 -
 77
77 -
 78
78 -
 79
79 -
 80
80 -
 81
81 -
 82
82 -
 83
83 -
 84
84 -
 85
85 -
 86
86 -
 87
87 -
 88
88 -
 89
89 -
 90
90 -
 91
91 -
 92
92 -
93
-
94
-
95
-
96
-
97
-
98
-
99
-
100
-
101
-
102
-
103
-
104
-
105
-
106
-
107
-
108
-
109
-
110
 |
 |

Management’s Discussion (Continued)
Finance and Financial Products
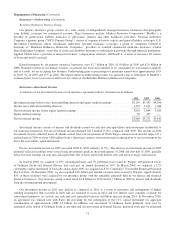
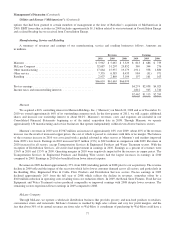
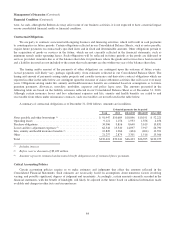
A summary of revenues and earnings from our finance and financial products businesses follows. Amounts are in millions.
Revenues Earnings
2010 2009 2008 2010 2009 2008
Manufactured housing and finance .................................. $3,256 $3,257 $3,560 $176 $187 $206
Furniture/transportation equipment leasing ............................ 660 661 773 53 14 87
Other .......................................................... 348 383 440 460 452 478
$4,264 $4,301 $4,773
Pre-tax earnings ................................................. 689 653 771
Income taxes and noncontrolling interests ............................. 248 242 302
$441 $411 $469
Revenues in 2010 from our manufactured housing and finance business (Clayton Homes) of $3.3 billion were relatively
unchanged from 2009. Sales of manufactured homes declined approximately $40 million in 2010 versus 2009, reflecting an
increase in unit sales of approximately 6% which was more than offset by lower average selling prices primarily attributable to
product mix. Unit sales in the first half of 2010 benefitted from the home buyer tax credit, which expired in the second quarter
and as a result demand declined over the last half of the year. Interest and finance income increased in 2010 as a result of the
adoption of a new accounting pronouncement, which required us to consolidate securitized loan portfolios we originated several
years ago.
The operating results of Clayton Homes have been negatively affected by the economic recession as well as the credit
crisis. In addition, our manufactured housing programs have been at a competitive disadvantage compared to traditional single
family housing markets, which have been receiving significant interest rate subsidies from the U.S. government through
government agency insured mortgages. For the most part, these subsidies are not available to factory built homes. As a result,
manufactured housing construction, sales and related lending activities have been negatively impacted. Nevertheless, Clayton
Homes remains the largest manufactured housing business in the United States and we believe that it will continue to operate
profitably, even under the current conditions.
Pre-tax earnings of Clayton Homes in 2010 decreased $11 million (6%) versus 2009. Operating results in 2010 were
negatively impacted by reduced earnings from manufactured home sales, partially offset by increased financial services
earnings. Installment loan balances were approximately $13.5 billion as of December 31, 2010 (including about $1.3 billion
related to securitized loans consolidated in 2010) versus $12.3 billion as of December 31, 2009.
Revenues in 2009 of Clayton Homes declined $303 million (9%) from 2008. The decrease was primarily due to a 16%
decline in units sold, partially offset by higher average selling prices and a slight increase in installment loan interest and other
investment income. Pre-tax earnings of Clayton Homes were $187 million in 2009, a decline of $19 million (9%) from 2008.
Pre-tax earnings in 2009 were negatively impacted by a $79 million increase in estimated loan loss provisions, partially offset
by improved margins from manufactured home sales and lower selling, general and administrative expenses arising from cost
reduction efforts.
Revenues from our furniture and transportation equipment leasing activities in 2010 were relatively unchanged from 2009.
Pre-tax earnings in 2010 were $53 million, an increase of $39 million over 2009. The earnings increase in 2010 was primarily
attributable to cost containment efforts as well as improved transportation equipment utilization.
Revenues and pre-tax earnings from our furniture/transportation equipment leasing businesses in 2009 declined
$112 million (14%) and $73 million (84%), respectively, compared to 2008. The declines primarily reflected lower rental
income driven by relatively low utilization rates for over-the-road trailer and storage units, and lower furniture rentals.
Significant cost components of this business are fixed (depreciation and facility expenses), so earnings declined
disproportionately to revenues.
Other finance business earnings include investment income generated on fixed maturity and equity investments, including
portions of our investments in Goldman Sachs and Wrigley securities as well as revenues and earnings from other miscellaneous
activities. In addition, other activities include earnings from internal interest rate spreads charged to Clayton Homes on
80