Berkshire Hathaway 2010 Annual Report Download - page 92
Download and view the complete annual report
Please find page 92 of the 2010 Berkshire Hathaway annual report below. You can navigate through the pages in the report by either clicking on the pages listed below, or by using the keyword search tool below to find specific information within the annual report.-
 1
1 -
2
-
3
-
4
-
5
-
6
-
7
-
8
-
9
-
10
-
11
-
12
-
13
-
14
-
15
-
16
-
17
-
18
-
19
-
20
-
21
-
22
-
23
-
24
-
25
-
26
-
27
-
28
-
29
-
30
-
31
-
32
-
33
-
34
-
35
-
36
-
37
-
38
-
39
-
40
-
41
-
42
-
43
-
44
-
45
-
46
-
47
-
48
-
49
-
50
-
51
-
52
-
53
-
54
-
55
-
56
-
57
-
58
-
59
-
60
-
61
-
62
-
63
-
64
-
65
-
66
-
67
-
68
-
69
-
70
-
71
-
72
-
73
-
74
-
75
-
76
-
77
-
78
-
79
-
80
-
81
-
 82
82 -
 83
83 -
 84
84 -
 85
85 -
 86
86 -
 87
87 -
 88
88 -
 89
89 -
 90
90 -
 91
91 -
 92
92 -
 93
93 -
 94
94 -
 95
95 -
 96
96 -
 97
97 -
 98
98 -
 99
99 -
 100
100 -
 101
101 -
 102
102 -
103
-
104
-
105
-
106
-
107
-
108
-
109
-
110
 |
 |

Management’s Discussion (Continued)
Property and casualty losses (Continued)
General Re (Continued)
Overall industry-wide loss experience data and informed judgment are used when internal loss data is of limited reliability,
such as in setting the estimates for mass tort, asbestos and hazardous waste (collectively, “mass tort”) claims. Unpaid mass tort
reserves at December 31, 2010 and 2009 were approximately $1.7 billion gross and $1.3 billion net of reinsurance. Mass tort net
claims paid were about $89 million in 2010. In 2010, ultimate loss estimates for asbestos and environmental claims were
increased by $70 million. In addition to the previously described methodologies, we consider “survival ratios” based on net
claim payments in recent years versus net unpaid losses as a rough guide to reserve adequacy. The survival ratio based on claim
payments made over the last three years was approximately 14 years as of December 31, 2010. The reinsurance industry’s
comparable survival ratio for asbestos and pollution reserves was approximately 10 years. Estimating mass tort losses is very
difficult due to the changing legal environment. Although such reserves are believed to be adequate, significant reserve
increases may be required in the future if new exposures or claimants are identified, new claims are reported or new theories of
liability emerge.
BHRG
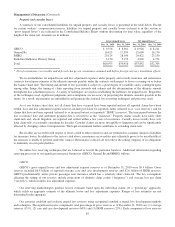
BHRG’s unpaid losses and loss adjustment expenses as of December 31, 2010 are summarized as follows. Amounts are
in millions.
Property Casualty Total
Reported case reserves ........................................................... $1,456 $ 2,791 $ 4,247
IBNR reserves .................................................................. 2,253 3,904 6,157
Retroactive .................................................................... — 18,720 18,720
Gross reserves .................................................................. $3,709 $25,415 29,124
Deferred charges and ceded reserves ................................................ (4,702)
Net reserves .................................................................... $24,422
In general, the methodologies we use to establish loss reserves vary widely and encompass many of the common
methodologies employed in the actuarial field today. Certain traditional methodologies such as paid and incurred loss
development techniques, incurred and paid loss Bornhuetter-Ferguson techniques and frequency and severity techniques are
utilized as well as ground-up techniques where appropriate. Additional judgments must also be employed to consider changes in
contract conditions and terms as well as the incidence of litigation or legal and regulatory change.
As of December 31, 2010, our gross loss reserves related to retroactive reinsurance policies were predominately for
casualty or liability losses. Our retroactive policies include excess-of-loss contracts, in which losses (relating to loss events
occurring before a specified date on or before the contract date) above a contractual retention are indemnified or contracts that
indemnify all losses paid by the counterparty after the policy effective date. We paid retroactive reinsurance losses and loss
adjustment expenses of approximately $1.8 billion in 2010. The classification “reported case reserves” has no practical
analytical value with respect to retroactive policies since the amount is often derived from reports in bulk from ceding
companies, who may have inconsistent definitions of “case reserves.” We review and establish loss reserve estimates, including
estimates of IBNR reserves, in the aggregate by contract.
In establishing retroactive reinsurance reserves, we often analyze historical aggregate loss payment patterns and project
losses into the future under various scenarios. The claim-tail is expected to be very long for many policies and may last several
decades. We assign judgmental probability factors to these aggregate loss payment scenarios and an expectancy outcome is
determined. We monitor claim payment activity and review ceding company reports and other information concerning the
underlying losses. Since the claim-tail is expected to be very long for such contracts, we reassess expected ultimate losses as
significant events related to the underlying losses are reported or revealed during the monitoring and review process. During
2010, retroactive reserves developed downward by $191 million.
BHRG’s liabilities for environmental, asbestos and latent injury losses and loss adjustment expenses were approximately
$10.7 billion at December 31, 2010 and $9.1 billion at December 31, 2009 and were concentrated within retroactive reinsurance
90