Berkshire Hathaway 2010 Annual Report Download - page 45
Download and view the complete annual report
Please find page 45 of the 2010 Berkshire Hathaway annual report below. You can navigate through the pages in the report by either clicking on the pages listed below, or by using the keyword search tool below to find specific information within the annual report.-
 1
1 -
2
-
3
-
4
-
5
-
6
-
7
-
8
-
9
-
10
-
11
-
12
-
13
-
14
-
15
-
16
-
17
-
18
-
19
-
20
-
21
-
22
-
23
-
24
-
25
-
26
-
27
-
28
-
29
-
30
-
31
-
32
-
33
-
34
-
 35
35 -
 36
36 -
 37
37 -
 38
38 -
 39
39 -
 40
40 -
 41
41 -
 42
42 -
 43
43 -
 44
44 -
 45
45 -
 46
46 -
 47
47 -
 48
48 -
 49
49 -
 50
50 -
 51
51 -
 52
52 -
 53
53 -
 54
54 -
 55
55 -
56
-
57
-
58
-
59
-
60
-
61
-
62
-
63
-
64
-
65
-
66
-
67
-
68
-
69
-
70
-
71
-
72
-
73
-
74
-
75
-
76
-
77
-
78
-
79
-
80
-
81
-
82
-
83
-
84
-
85
-
86
-
87
-
88
-
89
-
90
-
91
-
92
-
93
-
94
-
95
-
96
-
97
-
98
-
99
-
100
-
101
-
102
-
103
-
104
-
105
-
106
-
107
-
108
-
109
-
110
 |
 |

Notes to Consolidated Financial Statements (Continued)
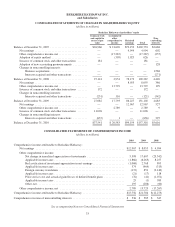
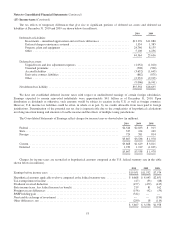
(4) Investments in equity securities
Investments in equity securities as of December 31, 2010 and 2009 are summarized below (in millions).
Cost Basis
Unrealized
Gains
Unrealized
Losses
Fair
Value
December 31, 2010
American Express Company ........................................... $ 1,287 $ 5,220 $ — $ 6,507
The Coca-Cola Company .............................................. 1,299 11,855 — 13,154
The Procter & Gamble Company ........................................ 4,321 336 — 4,657
Wells Fargo & Company .............................................. 8,015 3,521 (413) 11,123
Other .............................................................. 20,622 5,709 (259) 26,072
$35,544 $26,641 $ (672) $61,513
Insurance and other .................................................. $34,875 $25,616 $ (672) $59,819
Railroad, utilities and energy * ......................................... 232 950 — 1,182
Finance and financial products * ........................................ 437 75 — 512
$35,544 $26,641 $ (672) $61,513
December 31, 2009
American Express Company ........................................... $ 1,287 $ 4,856 $ — $ 6,143
The Coca-Cola Company .............................................. 1,299 10,101 — 11,400
The Procter & Gamble Company ........................................ 4,962 78 — 5,040
Wells Fargo & Company .............................................. 7,394 2,721 (1,094) 9,021
Other .............................................................. 22,265 7,118 (1,953) 27,430
$37,207 $24,874 $(3,047) $59,034
Insurance and other .................................................. $36,538 $23,070 $(3,046) $56,562
Railroad, utilities and energy * ......................................... 232 1,754 — 1,986
Finance and financial products * ........................................ 437 50 (1) 486
$37,207 $24,874 $(3,047) $59,034
* Included in Other assets.
Unrealized losses of equity investments at December 31, 2010 that were in a continuous loss position for more than twelve
months and for which other-than-temporary impairment charges were not recorded were $531 million, including $384 million
related to Wells Fargo & Company. As of December 31, 2009, unrealized losses over one year in duration were approximately
$2.7 billion, including $832 million related to Wells Fargo & Company. As of December 31, 2010, such losses generally ranged
between 3% and 15% of the original cost of the related individual securities. We believe that the impairment of each of the
individual securities that have been in an unrealized loss position over twelve months as of December 31, 2010 is temporary.
Our belief is based on (a) our ability and current intent to hold the securities to recovery; (b) our assessment that the underlying
business and financial condition of the issuers improved over the past year and that such conditions are currently favorable;
(c) our opinion that the relative price declines are not significant; (d) the fact that the market prices of these issuers have
increased over the past year; and (e) our belief that it is reasonably possible that market prices will increase to and exceed our
cost in a relatively short period of time. Changes in market conditions and other facts and circumstances may change the
business prospects of these issuers as well as our ability and current intent to hold these securities until the prices recover.
During the fourth quarter of 2010, we recorded other-than-temporary impairment losses of $938 million related to certain
other equity securities. These securities had been in unrealized loss positions for over two years. The amount of the impairments
averaged about 20% of the original cost of each security. Other-than-temporary impairment losses result in a reduction of the
cost basis of the investment but not the fair value. Accordingly, such losses that are included in earnings are offset by a
corresponding credit to other comprehensive income.
43