Berkshire Hathaway 2010 Annual Report Download - page 58
Download and view the complete annual report
Please find page 58 of the 2010 Berkshire Hathaway annual report below. You can navigate through the pages in the report by either clicking on the pages listed below, or by using the keyword search tool below to find specific information within the annual report.
Notes to Consolidated Financial Statements (Continued)
(17) Fair value measurements (Continued)
price, expected volatility, dividend and interest rates and contract duration. Credit default contracts are primarily valued
based on indications of bid or offer data as of the balance sheet date. These contracts are not exchange traded and certain of
the terms of our contracts are not standard in derivatives markets. For example, we are not required to post collateral under
most of our contracts. For these reasons, we classified these contracts as Level 3.
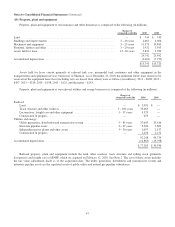
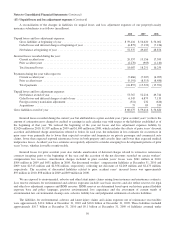
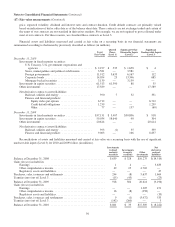
Financial assets and liabilities measured and carried at fair value on a recurring basis in our financial statements are
summarized according to the hierarchy previously described as follows (in millions).
Total
Fair Value
Quoted
Prices
(Level 1)
Significant Other
Observable Inputs
(Level 2)
Significant
Unobservable Inputs
(Level 3)
December 31, 2010
Investments in fixed maturity securities:
U.S. Treasury, U.S. government corporations and
agencies ..................................... $ 2,197 $ 535 $ 1,658 $ 4
States, municipalities and political subdivisions ........ 3,581 — 3,581 —
Foreign governments ............................. 11,912 5,633 6,167 112
Corporate bonds ................................. 14,054 23 13,346 685
Mortgage-backed securities ........................ 3,139 — 3,139 —
Investments in equity securities ......................... 61,513 61,390 88 35
Other investments ................................... 17,589 — — 17,589
Net derivative contract (assets)/liabilities:
Railroad, utilities and energy ....................... 390 7 52 331
Finance and financial products:
Equity index put options ...................... 6,712 — — 6,712
Credit default obligations ..................... 1,239 — — 1,239
Other ..................................... 77 — 137 (60)
December 31, 2009
Investments in fixed maturity securities .................. $37,131 $ 5,407 $30,806 $ 918
Investments in equity securities ......................... 59,034 58,640 90 304
Other investments ................................... 20,614 — — 20,614
Net derivative contract (assets)/liabilities:
Railroad, utilities and energy ....................... 393 (1) 35 359
Finance and financial products ..................... 9,003 — 166 8,837
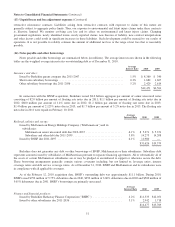
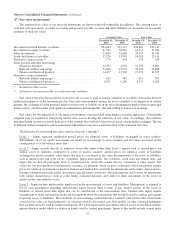
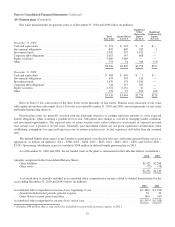
Reconciliations of assets and liabilities measured and carried at fair value on a recurring basis with the use of significant
unobservable inputs (Level 3) for 2010 and 2009 follow (in millions).
Investments
in fixed
maturity
securities
Investments
in equity
securities
Other
investments
Net
derivative
contract
liabilities
Balance at December 31, 2008 ...................................... $639 $328 $10,275 $(14,519)
Gains (losses) included in:
Earnings .................................................... 1 4 — 3,635
Other comprehensive income ................................... 49 25 4,702 —
Regulatory assets and liabilities .................................. — — — 47
Purchases, sales, issuances and settlements ............................. 244 (8) 5,637 1,664
Transfers into (out of) Level 3 ....................................... (15) (45) — (23)
Balance at December 31, 2009 ...................................... 918 304 20,614 (9,196)
Gains (losses) included in:
Earnings .................................................... — — 1,305 471
Other comprehensive income ................................... 16 (8) (358) —
Regulatory assets and liabilities .................................. — — — (33)
Purchases, sales, issuances and settlements ............................. 9 (1) (3,972) 533
Transfers into (out of) Level 3 ....................................... (142) (260) — 3
Balance at December 31, 2010 ...................................... $801 $ 35 $17,589 $ (8,222)
56


