Berkshire Hathaway 2010 Annual Report Download - page 69
Download and view the complete annual report
Please find page 69 of the 2010 Berkshire Hathaway annual report below. You can navigate through the pages in the report by either clicking on the pages listed below, or by using the keyword search tool below to find specific information within the annual report.-
 1
1 -
2
-
3
-
4
-
5
-
6
-
7
-
8
-
9
-
10
-
11
-
12
-
13
-
14
-
15
-
16
-
17
-
18
-
19
-
20
-
21
-
22
-
23
-
24
-
25
-
26
-
27
-
28
-
29
-
30
-
31
-
32
-
33
-
34
-
35
-
36
-
37
-
38
-
39
-
40
-
41
-
42
-
43
-
44
-
45
-
46
-
47
-
48
-
49
-
50
-
51
-
52
-
53
-
54
-
55
-
56
-
57
-
58
-
 59
59 -
 60
60 -
 61
61 -
 62
62 -
 63
63 -
 64
64 -
 65
65 -
 66
66 -
 67
67 -
 68
68 -
 69
69 -
 70
70 -
 71
71 -
 72
72 -
 73
73 -
 74
74 -
 75
75 -
 76
76 -
 77
77 -
 78
78 -
 79
79 -
80
-
81
-
82
-
83
-
84
-
85
-
86
-
87
-
88
-
89
-
90
-
91
-
92
-
93
-
94
-
95
-
96
-
97
-
98
-
99
-
100
-
101
-
102
-
103
-
104
-
105
-
106
-
107
-
108
-
109
-
110
 |
 |

BERKSHIRE HATHAWAY INC.
and Subsidiaries
Management’s Discussion and Analysis of
Financial Condition and Results of Operations
Results of Operations
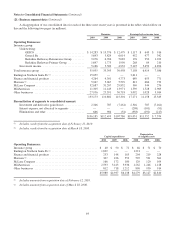
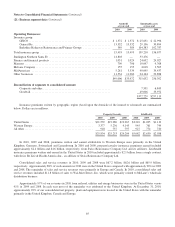
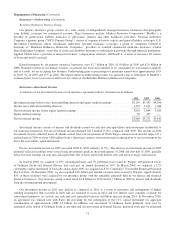
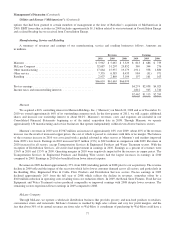
Net earnings attributable to Berkshire for each of the past three years are disaggregated in the table that follows. Amounts
are after deducting income taxes and exclude earnings attributable to noncontrolling interests. Amounts are in millions.
2010 2009 2008
Insurance – underwriting .......................................................... $ 1,301 $ 949 $ 1,739
Insurance – investment income ...................................................... 3,860 4,271 3,610
Railroad ........................................................................ 2,235* — —
Utilities and energy ............................................................... 1,131 1,071 1,704
Manufacturing, service and retailing ................................................. 2,462 1,113 2,283
Finance and financial products ...................................................... 441 411 469
Other .......................................................................... (337) (246) (166)
Investment and derivative gains/losses ................................................ 1,874 486 (4,645)
Net earnings attributable to Berkshire ............................................ $12,967 $8,055 $ 4,994
*Earnings are for the period between February 13 and December 31, 2010.
Our operating businesses are managed on an unusually decentralized basis. There are essentially no centralized or
integrated business functions (such as sales, marketing, purchasing, legal or human resources) and there is minimal involvement
by our corporate headquarters in the day-to-day business activities of the operating businesses. Our corporate senior
management team participates in and is ultimately responsible for significant capital allocation decisions, investment activities
and the selection of the Chief Executive to head each of the operating businesses. The business segment data (Note 21 to the
Consolidated Financial Statements) should be read in conjunction with this discussion.
On February 12, 2010, we completed the acquisition of the 77.5% of BNSF common stock that we did not already own.
Beginning as of February 13, 2010, BNSF’s results and net earnings are included fully in our consolidated results and net
earnings. In 2009 and until February 12, 2010, our share of net earnings related to our previously held investments in BNSF, as
determined under the equity method, is included as a component of insurance investment income in the preceding table.
Over the last half of 2008 and throughout 2009, operating results of many of our businesses were adversely impacted by
the world-wide economic recession. While our two largest business segments, which in 2009 were insurance and utilities,
remained strong and operating results were not negatively impacted in any significant way by the recession, earnings of most of
our diverse group of manufacturing, service and retailing businesses declined during 2009 as compared to the preceding two
years. The effects from the economic recession resulted in lower sales volume and profit margins as consumers significantly
curtailed spending, particularly for discretionary items. In 2010, operating results for many of our manufacturing, service and
retailing businesses improved versus 2009, reflecting some stabilization of economic conditions.
In 2010, we realized after-tax investment and derivative gains of approximately $1.9 billion. The gains included a
one-time holding gain of $979 million related to our acquisition of BNSF, net realized gains from the dispositions of
investments, and net gains from derivative contracts, partially offset by non-cash other-than-temporary impairment losses
recorded with respect to certain fixed maturity and equity securities. In 2009, we realized after-tax investment and derivative
gains of $486 million, while in 2008 we had losses of approximately $4.6 billion. In 2009 and 2008, the gains and losses
primarily derived from credit default contracts, dispositions of equity securities, other-than-temporary impairment losses
with respect to certain equity securities and changes in estimated fair values of long duration equity index put option
contracts. Changes in the equity and credit markets from period to period can and have caused significant volatility in
periodic earnings.
In response to the crises in the financial markets and the global recession, the U.S. government and governments around
the world are taking measures to regulate financial institutions, stabilize financial markets (including over-the-counter
67