Berkshire Hathaway 2010 Annual Report Download - page 76
Download and view the complete annual report
Please find page 76 of the 2010 Berkshire Hathaway annual report below. You can navigate through the pages in the report by either clicking on the pages listed below, or by using the keyword search tool below to find specific information within the annual report.-
 1
1 -
2
-
3
-
4
-
5
-
6
-
7
-
8
-
9
-
10
-
11
-
12
-
13
-
14
-
15
-
16
-
17
-
18
-
19
-
20
-
21
-
22
-
23
-
24
-
25
-
26
-
27
-
28
-
29
-
30
-
31
-
32
-
33
-
34
-
35
-
36
-
37
-
38
-
39
-
40
-
41
-
42
-
43
-
44
-
45
-
46
-
47
-
48
-
49
-
50
-
51
-
52
-
53
-
54
-
55
-
56
-
57
-
58
-
59
-
60
-
61
-
62
-
63
-
64
-
65
-
 66
66 -
 67
67 -
 68
68 -
 69
69 -
 70
70 -
 71
71 -
 72
72 -
 73
73 -
 74
74 -
 75
75 -
 76
76 -
 77
77 -
 78
78 -
 79
79 -
 80
80 -
 81
81 -
 82
82 -
 83
83 -
 84
84 -
 85
85 -
 86
86 -
87
-
88
-
89
-
90
-
91
-
92
-
93
-
94
-
95
-
96
-
97
-
98
-
99
-
100
-
101
-
102
-
103
-
104
-
105
-
106
-
107
-
108
-
109
-
110
 |
 |

Management’s Discussion (Continued)
Insurance—Investment Income (Continued)
at the option of General Electric beginning in October 2011. We anticipate that both of these securities will be redeemed in
2011. The negative impact on investment income from these events may be partially offset to the extent that dividend rates
increase with respect to certain of our major common stock investments.
Insurance investment income also includes earnings from equity method investments (BNSF and Moody’s). Equity method
earnings represented our proportionate share of the net earnings of these companies. As a result of a reduction of our ownership
of Moody’s in July of 2009, we discontinued the use of the equity method for our investment in Moody’s as of the beginning of
the third quarter of 2009. As a result of our acquisition of the remaining outstanding stock of BNSF on February 12, 2010, we
discontinued the use of the equity method and BNSF’s accounts are now included in our Consolidated Financial Statements
beginning as of February 13, 2010. Dividends received on equity method investments are not reflected in our earnings.
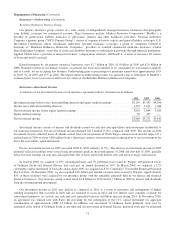
Invested assets derive from shareholder capital and reinvested earnings as well as net liabilities under insurance contracts
or “float.” The major components of float are unpaid losses, life, annuity and health benefit liabilities, unearned premiums and
other liabilities to policyholders less premium and reinsurance receivables, deferred charges assumed under retroactive
reinsurance contracts and deferred policy acquisition costs. Float approximated $66 billion at December 31, 2010, $63 billion at
December 31, 2009 and $60 billion at December 31, 2008, respectively. The cost of float, as represented by the ratio of
underwriting gain or loss to average float, was negative for the last three years, as our insurance business generated
underwriting gains in each year.
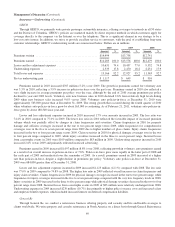
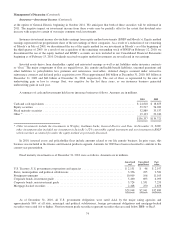
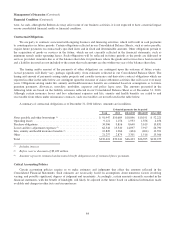
A summary of cash and investments held in our insurance businesses follows. Amounts are in millions.
2010 2009
Cash and cash equivalents ............................................................... $ 24,818 $ 18,655
Equity securities ...................................................................... 59,517 56,289
Fixed maturity securities ................................................................ 32,889 35,537
Other * .............................................................................. 19,133 29,240
$136,357 $139,721
*Other investments include the investments in Wrigley, Goldman Sachs, General Electric and Dow. At December 31, 2009,
other investments also included our investment in Swiss Re’s 12% convertible capital instrument and our investment in BNSF
which was then accounted for under the equity method as previously discussed.
In 2010, invested assets and policyholder float include amounts related to our life annuity business. In prior years, this
business was included in the finance and financial products segment. Amounts for 2009 have been reclassified to conform to the
current year presentation.
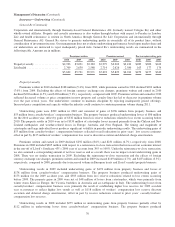
Fixed maturity investments as of December 31, 2010 were as follows. Amounts are in millions.
Amortized
cost
Unrealized
gains/losses
Fair
value
U.S. Treasury, U.S. government corporations and agencies ............................ $ 2,151 $ 46 $ 2,197
States, municipalities and political subdivisions ..................................... 3,356 225 3,581
Foreign governments .......................................................... 10,909 196 11,105
Corporate bonds, investment grade ............................................... 5,400 693 6,093
Corporate bonds, non-investment grade ........................................... 5,724 1,531 7,255
Mortgage-backed securities ..................................................... 2,408 250 2,658
$29,948 $2,941 $32,889
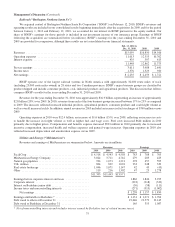
As of December 31, 2010, all U.S. government obligations were rated AAA by the major rating agencies and
approximately 86% of all state, municipal and political subdivisions, foreign government obligations and mortgage-backed
securities were rated AA or higher. Non-investment grade securities represent securities that are rated below BBB- or Baa3.
74