Berkshire Hathaway 2010 Annual Report Download - page 77
Download and view the complete annual report
Please find page 77 of the 2010 Berkshire Hathaway annual report below. You can navigate through the pages in the report by either clicking on the pages listed below, or by using the keyword search tool below to find specific information within the annual report.-
 1
1 -
2
-
3
-
4
-
5
-
6
-
7
-
8
-
9
-
10
-
11
-
12
-
13
-
14
-
15
-
16
-
17
-
18
-
19
-
20
-
21
-
22
-
23
-
24
-
25
-
26
-
27
-
28
-
29
-
30
-
31
-
32
-
33
-
34
-
35
-
36
-
37
-
38
-
39
-
40
-
41
-
42
-
43
-
44
-
45
-
46
-
47
-
48
-
49
-
50
-
51
-
52
-
53
-
54
-
55
-
56
-
57
-
58
-
59
-
60
-
61
-
62
-
63
-
64
-
65
-
66
-
 67
67 -
 68
68 -
 69
69 -
 70
70 -
 71
71 -
 72
72 -
 73
73 -
 74
74 -
 75
75 -
 76
76 -
 77
77 -
 78
78 -
 79
79 -
 80
80 -
 81
81 -
 82
82 -
 83
83 -
 84
84 -
 85
85 -
 86
86 -
 87
87 -
88
-
89
-
90
-
91
-
92
-
93
-
94
-
95
-
96
-
97
-
98
-
99
-
100
-
101
-
102
-
103
-
104
-
105
-
106
-
107
-
108
-
109
-
110
 |
 |

Management’s Discussion (Continued)
Railroad (“Burlington Northern Santa Fe”)
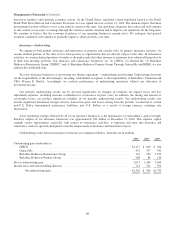
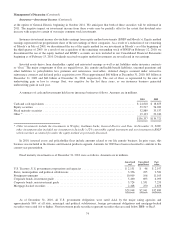
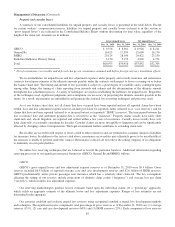
We acquired control of Burlington Northern Santa Fe Corporation (“BNSF”) on February 12, 2010. BNSF’s revenues and
operating results are included in our consolidated results beginning immediately after the acquisition. In 2009 and for the period
between January 1, 2010 and February 12, 2010, we accounted for our interest in BNSF pursuant to the equity method. Our
share of BNSF’s earnings for those periods is included in net investment income of our insurance group. Earnings of BNSF
following the acquisition are summarized below (in millions). BNSF’s earnings for the years ending December 31, 2010 and
2009 are provided for comparison, although these results are not consolidated in our financial statements.
Feb. 13, 2010 to
Dec. 31, 2010 2010 2009
Revenues ................................................................. $15,059 $16,850 $14,016
Operating expenses ......................................................... 11,013 12,355 10,762
Interest expense ............................................................ 435 507 613
11,448 12,862 11,375
Pre-tax earnings ............................................................ 3,611 3,988 2,641
Income taxes .............................................................. 1,376 1,529 920
Net earnings ............................................................... $ 2,235 $ 2,459 $ 1,721
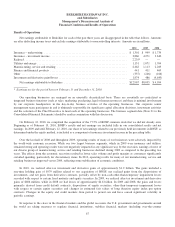
BNSF operates one of the largest railroad systems in North America with approximately 32,000 route miles of track
(including 23,000 route miles owned) in 28 states and two Canadian provinces. BNSF’s major business groups are classified by
product shipped and include consumer products, coal, industrial products and agricultural products. The discussion that follows
compares BNSF’s results for the years ending December 31, 2010 and 2009.
Revenues for the year ending December 31, 2010 were approximately $16.9 billion, representing an increase of approximately
$2.8 billion (20%) over 2009. In 2010, revenues from each of the four business groups increased between 17% to 23% as compared
to 2009. The increases reflected increased industrial products, agricultural products, consumer products and coal freight volume as
well as overall increased yields. In addition, annual revenues in 2010 included an increase in fuel surcharges of $740 million versus
2009.
Operating expenses in 2010 were $12.4 billion, an increase of $1.6 billion (15%) over 2009, reflecting an increase in costs
to handle the increase in freight volume as well as higher fuel and wage costs. Fuel costs increased $644 million in 2010
primarily due to higher prices. Compensation and benefits expense increased $523 million in 2010 primarily due to increased
incentive compensation, increased health and welfare expenses and general wage increases. Operating expenses in 2010 also
reflected increased depreciation and amortization expense versus 2009.
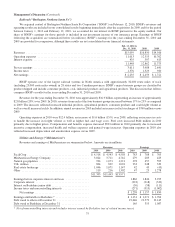
Utilities and Energy (“MidAmerican”)
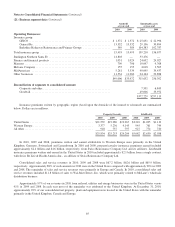
Revenues and earnings of MidAmerican are summarized below. Amounts are in millions.
Revenues Earnings
2010 2009 2008 2010 2009 2008
PacifiCorp ........................................... $ 4,518 $ 4,543 $ 4,558 $ 783 $ 788 $ 703
MidAmerican Energy Company .......................... 3,824 3,711 4,742 279 285 425
Natural gas pipelines ................................... 994 1,073 1,221 378 457 595
U.K. utilities ......................................... 804 829 1,001 333 248 339
Real estate brokerage .................................. 1,046 1,071 1,147 42 43 (45)
Other ............................................... 119 216 1,302 47 25 1,278
$11,305 $11,443 $13,971
Earnings before corporate interest and taxes ................ 1,862 1,846 3,295
Corporate interest ..................................... (323) (318) (332)
Interest on Berkshire junior debt .......................... (30) (58) (111)
Income taxes and noncontrolling interests .................. (271) (313) (1,002)
Net earnings ...................................... $ 1,238 $ 1,157 $ 1,850
Earnings attributable to Berkshire * ....................... $ 1,131 $ 1,071 $ 1,704
Debt owed to others at December 31 ...................... 19,646 19,579 19,145
Debt owed to Berkshire at December 31 ................... 165 353 1,087
*Net of noncontrolling interests and includes interest earned by Berkshire (net of related income taxes).
75