Berkshire Hathaway 2010 Annual Report Download - page 47
Download and view the complete annual report
Please find page 47 of the 2010 Berkshire Hathaway annual report below. You can navigate through the pages in the report by either clicking on the pages listed below, or by using the keyword search tool below to find specific information within the annual report.-
 1
1 -
2
-
3
-
4
-
5
-
6
-
7
-
8
-
9
-
10
-
11
-
12
-
13
-
14
-
15
-
16
-
17
-
18
-
19
-
20
-
21
-
22
-
23
-
24
-
25
-
26
-
27
-
28
-
29
-
30
-
31
-
32
-
33
-
34
-
35
-
36
-
 37
37 -
 38
38 -
 39
39 -
 40
40 -
 41
41 -
 42
42 -
 43
43 -
 44
44 -
 45
45 -
 46
46 -
 47
47 -
 48
48 -
 49
49 -
 50
50 -
 51
51 -
 52
52 -
 53
53 -
 54
54 -
 55
55 -
 56
56 -
 57
57 -
58
-
59
-
60
-
61
-
62
-
63
-
64
-
65
-
66
-
67
-
68
-
69
-
70
-
71
-
72
-
73
-
74
-
75
-
76
-
77
-
78
-
79
-
80
-
81
-
82
-
83
-
84
-
85
-
86
-
87
-
88
-
89
-
90
-
91
-
92
-
93
-
94
-
95
-
96
-
97
-
98
-
99
-
100
-
101
-
102
-
103
-
104
-
105
-
106
-
107
-
108
-
109
-
110
 |
 |

Notes to Consolidated Financial Statements (Continued)
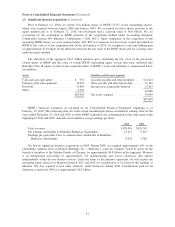
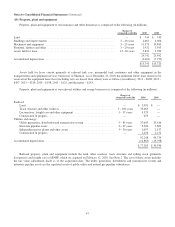
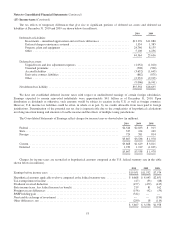
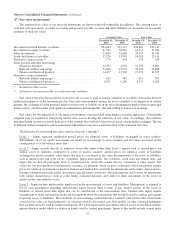
(6) Investment gains/losses
Investment gains/losses are summarized below (in millions).
2010 2009 2008
Fixed maturity securities
Gross gains from sales and other disposals ........................................... $ 720 $357 $ 212
Gross losses from sales and other disposals .......................................... (16) (54) (20)
Equity and other securities
Gross gains from sales and other disposals ........................................... 2,603 701 1,256
Gross losses from sales .......................................................... (266) (617) (530)
Other ............................................................................ 1,017* (69) 255
$4,058 $ 318 $1,173
* Includes a one-time holding gain of $979 million related to the BNSF acquisition. See note 2.
Net investment gains/losses are reflected in the Consolidated Statements of Earnings as follows.
Insurance and other .................................................................. $4,044 $358 $1,166
Finance and financial products ......................................................... 14 (40) 7
$4,058 $318 $1,173
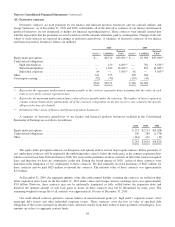
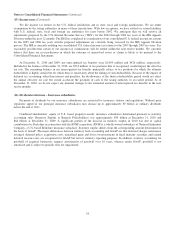
(7) Receivables
Receivables of insurance and other businesses are comprised of the following (in millions).
2010 2009
Insurance premiums receivable ............................................................. $ 6,342 $ 5,295
Reinsurance recoverable on unpaid losses .................................................... 2,735 2,922
Trade and other receivables ................................................................ 12,223 6,977
Allowances for uncollectible accounts ....................................................... (383) (402)
$20,917 $14,792
As of December 31, 2010, trade and other receivables included approximately $3.9 billion (CHF 3.7 billion) related to the
redemption of the Swiss Re convertible capital instrument. See Note 5.
Loans and finance receivables of finance and financial products businesses are comprised of the following (in millions).
2010 2009
Consumer installment loans and finance receivables ............................................ $14,042 $12,779
Commercial loans and finance receivables .................................................... 1,557 1,558
Allowances for uncollectible loans .......................................................... (373) (348)
$15,226 $13,989
Consumer installment loans receivable increased by approximately $1.5 billion as of January 1, 2010 due to the adoption of
ASU 2009-17. As of December 31, 2010, the outstanding balance of such loans was approximately $1.3 billion.
Allowances for uncollectible loans primarily relate to consumer installment loans. Provisions for consumer loan losses
were $343 million in 2010 and $380 million in 2009. Loan charge-offs were $349 million in 2010 and $335 million in 2009.
Consumer loan amounts are net of acquisition discounts of $580 million at December 31, 2010 and $594 million at
December 31, 2009. At December 31, 2010, approximately 96% of consumer installment loan balances were evaluated
collectively for impairment whereas about 91% of commercial loan balances were evaluated individually for impairment.
45