Berkshire Hathaway 2010 Annual Report Download - page 71
Download and view the complete annual report
Please find page 71 of the 2010 Berkshire Hathaway annual report below. You can navigate through the pages in the report by either clicking on the pages listed below, or by using the keyword search tool below to find specific information within the annual report.-
 1
1 -
2
-
3
-
4
-
5
-
6
-
7
-
8
-
9
-
10
-
11
-
12
-
13
-
14
-
15
-
16
-
17
-
18
-
19
-
20
-
21
-
22
-
23
-
24
-
25
-
26
-
27
-
28
-
29
-
30
-
31
-
32
-
33
-
34
-
35
-
36
-
37
-
38
-
39
-
40
-
41
-
42
-
43
-
44
-
45
-
46
-
47
-
48
-
49
-
50
-
51
-
52
-
53
-
54
-
55
-
56
-
57
-
58
-
59
-
60
-
 61
61 -
 62
62 -
 63
63 -
 64
64 -
 65
65 -
 66
66 -
 67
67 -
 68
68 -
 69
69 -
 70
70 -
 71
71 -
 72
72 -
 73
73 -
 74
74 -
 75
75 -
 76
76 -
 77
77 -
 78
78 -
 79
79 -
 80
80 -
 81
81 -
82
-
83
-
84
-
85
-
86
-
87
-
88
-
89
-
90
-
91
-
92
-
93
-
94
-
95
-
96
-
97
-
98
-
99
-
100
-
101
-
102
-
103
-
104
-
105
-
106
-
107
-
108
-
109
-
110
 |
 |

Management’s Discussion (Continued)
Insurance—Underwriting (Continued)
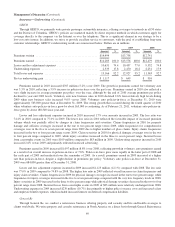
GEICO
Through GEICO, we primarily write private passenger automobile insurance, offering coverages to insureds in all 50 states
and the District of Columbia. GEICO’s policies are marketed mainly by direct response methods in which customers apply for
coverage directly to the company via the Internet or over the telephone. This is a significant element in our strategy to be a
low-cost auto insurer. In addition, we strive to provide excellent service to customers, with the goal of establishing long-term
customer relationships. GEICO’s underwriting results are summarized below. Dollars are in millions.
2010 2009 2008
Amount % Amount % Amount %
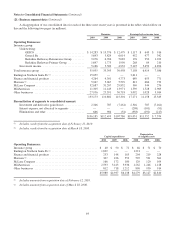
Premiums written ........................................... $14,494 $13,758 $12,741
Premiums earned ............................................ $14,283 100.0 $13,576 100.0 $12,479 100.0
Losses and loss adjustment expenses ............................ 10,631 74.4 10,457 77.0 9,332 74.8
Underwriting expenses ....................................... 2,535 17.8 2,470 18.2 2,231 17.9
Total losses and expenses ..................................... 13,166 92.2 12,927 95.2 11,563 92.7
Pre-tax underwriting gain ..................................... $ 1,117 $ 649 $ 916
Premiums earned in 2010 increased $707 million (5.2%) over 2009. The growth in premiums earned for voluntary auto
was 5.3% in 2010, reflecting a 5.9% increase in policies-in-force over the past year. Premiums earned in 2010 also reflected a
very slight increase in average premiums per policy over the year, although by the end of 2010 average premiums per policy
declined to year-end 2009 levels. Voluntary auto new business sales in 2010 declined 2.6% from relatively high levels during
2009 when new business sales increased 9.0% versus 2008. Voluntary auto policies-in-force at December 31, 2010 were
approximately 563,000 greater than at December 31, 2009. The strong growth that occurred during the fourth quarter of 2010
when voluntary auto policies-in-force grew by about 165,000 is continuing. As of February 21, 2011, voluntary auto policies-in-
force grew by about 188,500 since year-end.
Losses and loss adjustment expenses incurred in 2010 increased 1.7% over amounts incurred in 2009. The loss ratio was
74.4% in 2010 compared to 77.0% in 2009. The lower loss ratio in 2010 reflected the favorable impact of increased premium
volume which was partially offset by changes in claim frequencies and severities. Claims frequencies in 2010 for property
damage and collision coverages increased in the one to two percent range versus 2009, while frequencies for comprehensive
coverages rose in the five to seven percent range from 2009 due to higher numbers of glass claims. Injury claims frequencies
increased in the two to four percent range versus 2009. Claim severities in 2010 for physical damage coverages rose in the two
to four percent range compared to 2009, while injury severities increased in the three to seven percent range. Incurred losses
from catastrophe events in 2010 were $109 million compared to $83 million in 2009. Underwriting expenses incurred in 2010
increased 2.6% versus 2009 and primarily reflected increased advertising.
Premiums earned in 2009 increased $1,097 million (8.8%) over 2008, reflecting growth in voluntary auto premiums earned
as a result of an overall increase in policies-in-force of 7.8%. Policies-in-force grew more rapidly in the latter part of 2008 and
the early part of 2009 and moderated over the remainder of 2009. As a result, premiums earned in 2009 increased at a higher
rate than policies-in-force, despite a slight decline in premiums per policy. Voluntary auto policies-in-force at December 31,
2009 were 684,000 greater than at December 31, 2008.
Losses and loss adjustment expenses incurred in 2009 increased $1,125 million (12.1%) compared with 2008. The loss ratio
was 77.0% in 2009 compared to 74.8% in 2008. The higher loss ratio in 2009 reflected overall increases in claim frequencies and
injury claim severities. Claims frequencies in 2009 for physical damage coverages increased in the one to two percent range, while
frequencies for injury coverages increased in the five to seven percent range compared with the very low frequency levels in 2008.
Injury severities in 2009 increased in the three to five percent range while physical damage severities decreased in the two to four
percent range from 2008. Incurred losses from catastrophe events in 2009 of $83 million were relatively unchanged from 2008.
Underwriting expenses in 2009 increased $239 million (10.7%) due primarily to higher policy issuance costs and increased salary
and employee benefit expenses, which included increased interest on deferred compensation liabilities.
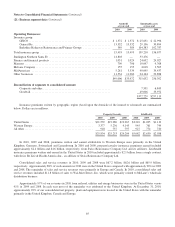
General Re
Through General Re, we conduct a reinsurance business offering property and casualty and life and health coverages to
clients worldwide. We write property and casualty reinsurance in North America on a direct basis through General Reinsurance
69