Berkshire Hathaway 2010 Annual Report Download - page 49
Download and view the complete annual report
Please find page 49 of the 2010 Berkshire Hathaway annual report below. You can navigate through the pages in the report by either clicking on the pages listed below, or by using the keyword search tool below to find specific information within the annual report.-
 1
1 -
2
-
3
-
4
-
5
-
6
-
7
-
8
-
9
-
10
-
11
-
12
-
13
-
14
-
15
-
16
-
17
-
18
-
19
-
20
-
21
-
22
-
23
-
24
-
25
-
26
-
27
-
28
-
29
-
30
-
31
-
32
-
33
-
34
-
35
-
36
-
37
-
38
-
 39
39 -
 40
40 -
 41
41 -
 42
42 -
 43
43 -
 44
44 -
 45
45 -
 46
46 -
 47
47 -
 48
48 -
 49
49 -
 50
50 -
 51
51 -
 52
52 -
 53
53 -
 54
54 -
 55
55 -
 56
56 -
 57
57 -
 58
58 -
 59
59 -
60
-
61
-
62
-
63
-
64
-
65
-
66
-
67
-
68
-
69
-
70
-
71
-
72
-
73
-
74
-
75
-
76
-
77
-
78
-
79
-
80
-
81
-
82
-
83
-
84
-
85
-
86
-
87
-
88
-
89
-
90
-
91
-
92
-
93
-
94
-
95
-
96
-
97
-
98
-
99
-
100
-
101
-
102
-
103
-
104
-
105
-
106
-
107
-
108
-
109
-
110
 |
 |

Notes to Consolidated Financial Statements (Continued)
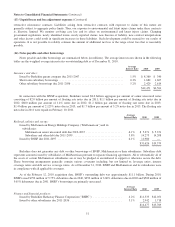
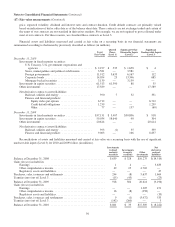
(10) Property, plant and equipment
Property, plant and equipment of our insurance and other businesses is comprised of the following (in millions).
Ranges of
estimated useful life 2010 2009
Land .................................................................. — $ 744 $ 740
Buildings and improvements ............................................... 3–40years 4,661 4,606
Machinery and equipment ................................................. 3–25years 11,573 10,845
Furniture, fixtures and other ................................................ 3–20years 1,932 1,595
Assets held for lease ...................................................... 12–30years 5,832 5,706
24,742 23,492
Accumulated depreciation ................................................. (9,001) (7,772)
$15,741 $15,720
Assets held for lease consist primarily of railroad tank cars, intermodal tank containers and other equipment in the
transportation and equipment services businesses of Marmon. As of December 31, 2010, the minimum future lease rentals to be
received on the equipment lease fleet (including rail cars leased from others) were as follows (in millions): 2011 – $608; 2012 –
$457; 2013 – $310; 2014 – $198; 2015 – $125; and thereafter – $243.
Property, plant and equipment of our railroad, utilities and energy businesses is comprised of the following (in millions).
Ranges of
estimated useful life 2010 2009
Railroad:
Land ............................................................. — $ 5,901 $ —
Track structure and other roadway ..................................... 5–100years 35,463 —
Locomotives, freight cars and other equipment ........................... 1–37years 4,329 —
Construction in progress ............................................. — 453 —
Utilities and energy:
Utility generation, distribution and transmission system .................... 5–85years 37,643 35,616
Interstate pipeline assets ............................................. 3–67years 5,906 5,809
Independent power plants and other assets ............................... 3–30years 1,097 1,157
Construction in progress ............................................. — 1,456 2,152
92,248 44,734
Accumulated depreciation ................................................ (14,863) (13,798)
$ 77,385 $ 30,936
Railroad property, plant and equipment include the land, other roadway, track structure and rolling stock (primarily
locomotives and freight cars) of BNSF, which we acquired on February 12, 2010. See Note 2. The cost of these assets includes
the fair value adjustments made as of the acquisition date. The utility generation, distribution and transmission system and
interstate pipeline assets are the regulated assets of public utility and natural gas pipeline subsidiaries.
47