Berkshire Hathaway 2010 Annual Report Download - page 81
Download and view the complete annual report
Please find page 81 of the 2010 Berkshire Hathaway annual report below. You can navigate through the pages in the report by either clicking on the pages listed below, or by using the keyword search tool below to find specific information within the annual report.Management’s Discussion (Continued)
Manufacturing, Service and Retailing (Continued)
Other service (Continued)
also included in this group are: TTI, a leading electronic components distributor; Business Wire, a leading distributor of
corporate news, multimedia and regulatory filings; The Pampered Chef, a direct seller of high quality kitchen tools;
International Dairy Queen, a licensor and service provider to about 6,000 stores that offer prepared dairy treats and food; The
Buffalo News, a publisher of a daily and Sunday newspaper; and businesses that provide management and other services to
insurance companies.
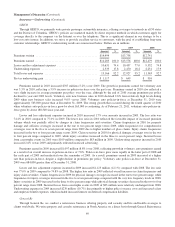
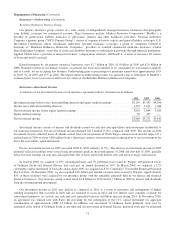
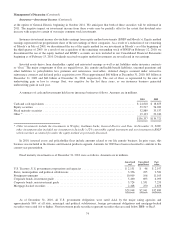
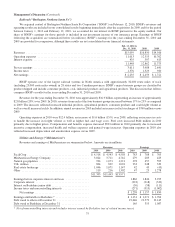
In 2010, revenues of our other service businesses were $7.4 billion, an increase of $770 million (12%) compared to 2009.
Pre-tax earnings in 2010 were $984 million compared to a loss of $91 million in 2009. The improved results were significantly
driven by improved operating results of NetJets and TTI.
In 2010, NetJets’ revenues increased 7% over 2009. The increase was due to higher worldwide flight revenue hours and
increased pass through costs, partially offset by lower management fees due to fewer aircraft in the NetJets program. NetJets
generated pre-tax earnings of $207 million in 2010 compared to a pre-tax loss of $711 million in 2009, which included
$676 million of asset writedowns and other downsizing costs. The asset write downs were primarily related to excess aircraft
that have been subsequently sold or are expected to be sold for cash consideration approximating their written down values.
Such costs in 2010 were relatively minor. On January 1, 2010, we began charging NetJets a guarantee fee related to the level of
its outstanding debt. The guarantee fee was $38 million in 2010. Had a similar fee been charged in 2009, NetJets’ pre-tax loss of
$711 million would have increased by $69 million. The improvement in earnings was due to the increase in revenues and to an
overall reduction in flight operations and administrative costs, partially offset by higher fuel costs. NetJets continues to own
more aircraft than is required for present operations and we expect to continue to dispose of selected aircraft over time. NetJets’
operating cost structure has been reduced to better match customer demand and we believe that NetJets will continue to operate
profitably in the future.
In 2010, revenues of TTI increased by approximately 45% over 2009 which was driven by very strong worldwide demand.
We primarily attribute the revenue increase to strong consumer demand for electronic products, as well as to manufacturers
replenishing depleted raw material inventories. We believe that the current strong market conditions will slow to more
normalized levels and as a result, we anticipate that revenues growth will slow significantly from the extraordinary rate
experienced in 2010. As a result of the increase in revenues, pre-tax earnings of TTI were significantly higher in 2010 compared
to 2009.
Revenues in 2009 were $6.6 billion, a decrease of $1.9 billion (22%) compared to 2008. Substantially all of our service
businesses generated lower revenues in 2009 as compared to 2008, particularly at NetJets and to a lesser degree at TTI. In 2009,
NetJets’ revenues declined 32% versus 2008 due to a 77% decline in aircraft sales as well as lower flight operations revenues
primarily due to a 19% decline in flight revenue hours. Revenues at TTI were 17% lower in 2009 compared to 2008 due to the
economic recession. NetJets produced a pre-tax loss in 2009 of $711 million compared to pre-tax earnings of $213 million in
2008. The pre-tax loss at NetJets in 2009 included the aforementioned asset writedowns and other downsizing costs of
$676 million compared to $54 million of such charges in 2008. Excluding the results of NetJets, our other service businesses
produced pre-tax earnings of $620 million in 2009 compared to pre-tax earnings of $758 million in 2008. The negative impact
of the global recession was evident at substantially all of our other service businesses.
Retailing
Our retailing operations consist of four home furnishings businesses (Nebraska Furniture Mart, R.C. Willey, Star Furniture
and Jordan’s), three jewelry businesses (Borsheims, Helzberg and Ben Bridge) and See’s Candies. In 2010, revenues were
$2.9 billion, an increase of 2% compared to 2009 and pre-tax earnings were $197 million, an increase of 22% compared to
2009. The increase in earnings in 2010 was due to the modest increase in sales and ongoing cost containment efforts. Retailing
revenues in 2009 decreased 8% compared to 2008. Pre-tax earnings of $161 million in 2009 were relatively unchanged from
2008. Throughout 2008 as the impact of the economic recession in the U.S. worsened, consumer spending declined and these
conditions continued in 2009.
79


