Berkshire Hathaway 2010 Annual Report Download - page 67
Download and view the complete annual report
Please find page 67 of the 2010 Berkshire Hathaway annual report below. You can navigate through the pages in the report by either clicking on the pages listed below, or by using the keyword search tool below to find specific information within the annual report.-
 1
1 -
2
-
3
-
4
-
5
-
6
-
7
-
8
-
9
-
10
-
11
-
12
-
13
-
14
-
15
-
16
-
17
-
18
-
19
-
20
-
21
-
22
-
23
-
24
-
25
-
26
-
27
-
28
-
29
-
30
-
31
-
32
-
33
-
34
-
35
-
36
-
37
-
38
-
39
-
40
-
41
-
42
-
43
-
44
-
45
-
46
-
47
-
48
-
49
-
50
-
51
-
52
-
53
-
54
-
55
-
56
-
 57
57 -
 58
58 -
 59
59 -
 60
60 -
 61
61 -
 62
62 -
 63
63 -
 64
64 -
 65
65 -
 66
66 -
 67
67 -
 68
68 -
 69
69 -
 70
70 -
 71
71 -
 72
72 -
 73
73 -
 74
74 -
 75
75 -
 76
76 -
 77
77 -
78
-
79
-
80
-
81
-
82
-
83
-
84
-
85
-
86
-
87
-
88
-
89
-
90
-
91
-
92
-
93
-
94
-
95
-
96
-
97
-
98
-
99
-
100
-
101
-
102
-
103
-
104
-
105
-
106
-
107
-
108
-
109
-
110
 |
 |

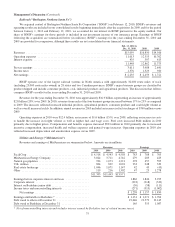
Notes to Consolidated Financial Statements (Continued)
(21) Business segment data (Continued)
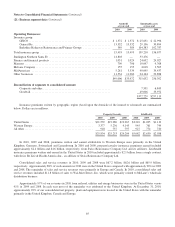
Goodwill
at year-end
Identifiable assets
at year-end
2010 2009 2010 2009
Operating Businesses:
Insurance group:
GEICO ......................................................... $ 1,372 $ 1,372 $ 25,631 $ 22,996
General Re ...................................................... 13,532 13,532 29,196 30,894
Berkshire Hathaway Reinsurance and Primary Groups ................... 589 589 104,383 102,787
Total insurance group ................................................. 15,493 15,493 159,210 156,677
Burlington Northern Santa Fe ........................................... 14,803 — 53,476 —
Finance and financial products .......................................... 1,031 1,024 24,692 24,027
Marmon ............................................................ 709 706 10,047 9,768
McLane Company .................................................... 155 155 4,018 3,505
MidAmerican ....................................................... 5,281 5,334 40,045 39,437
Other businesses ..................................................... 11,534 11,260 24,144 22,888
$49,006 $33,972 315,632 256,302
Reconciliation of segments to consolidated amount:
Corporate and other ............................................... 7,591 6,845
Goodwill ....................................................... 49,006 33,972
$372,229 $297,119
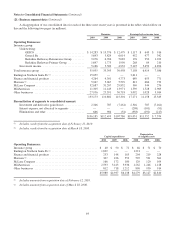
Insurance premiums written by geographic region (based upon the domicile of the insured or reinsured) are summarized
below. Dollars are in millions.
Property/Casualty Life/Health
2010 2009 2008 2010 2009 2008
United States ............................................ $21,539 $19,280 $19,267 $3,210 $1,095 $1,119
Western Europe .......................................... 3,377 5,236 4,145 945 761 749
All other ................................................ 918 737 797 927 774 720
$25,834 $25,253 $24,209 $5,082 $2,630 $2,588
In 2010, 2009 and 2008, premiums written and earned attributable to Western Europe were primarily in the United
Kingdom, Germany, Switzerland and Luxembourg. In 2010 and 2009, property/casualty insurance premiums earned included
approximately $2.4 billion and $4.6 billion, respectively, from Swiss Reinsurance Company Ltd. and its affiliates. Life/health
insurance premiums written and earned in the United States in 2010 included approximately $2.1 billion from a single contract
with Swiss Re Life & Health America Inc., an affiliate of Swiss Reinsurance Company Ltd.
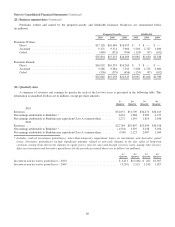
Consolidated sales and service revenues in 2010, 2009 and 2008 were $67.2 billion, $62.6 billion and $65.9 billion,
respectively. Approximately 88% of such amounts in 2010 were in the United States compared with approximately 90% in 2009
and 2008. The remainder of sales and service revenues were primarily in Europe and Canada. In 2010, consolidated sales and
service revenues included $11.8 billion of sales to Wal-Mart Stores, Inc. which were primarily related to McLane’s wholesale
distribution business.
Approximately 97% of our revenues in 2010 from railroad, utilities and energy businesses were in the United States versus
91% in 2009 and 2008. In each year most of the remainder was attributed to the United Kingdom. At December 31, 2010,
approximately 92% of our consolidated net property, plant and equipment were located in the United States with the remainder
primarily in the United Kingdom, Canada and Europe.
65