Berkshire Hathaway 2010 Annual Report Download - page 17
Download and view the complete annual report
Please find page 17 of the 2010 Berkshire Hathaway annual report below. You can navigate through the pages in the report by either clicking on the pages listed below, or by using the keyword search tool below to find specific information within the annual report.-
 1
1 -
2
-
3
-
4
-
5
-
6
-
 7
7 -
 8
8 -
 9
9 -
 10
10 -
 11
11 -
 12
12 -
 13
13 -
 14
14 -
 15
15 -
 16
16 -
 17
17 -
 18
18 -
 19
19 -
 20
20 -
 21
21 -
 22
22 -
 23
23 -
 24
24 -
 25
25 -
 26
26 -
 27
27 -
28
-
29
-
30
-
31
-
32
-
33
-
34
-
35
-
36
-
37
-
38
-
39
-
40
-
41
-
42
-
43
-
44
-
45
-
46
-
47
-
48
-
49
-
50
-
51
-
52
-
53
-
54
-
55
-
56
-
57
-
58
-
59
-
60
-
61
-
62
-
63
-
64
-
65
-
66
-
67
-
68
-
69
-
70
-
71
-
72
-
73
-
74
-
75
-
76
-
77
-
78
-
79
-
80
-
81
-
82
-
83
-
84
-
85
-
86
-
87
-
88
-
89
-
90
-
91
-
92
-
93
-
94
-
95
-
96
-
97
-
98
-
99
-
100
-
101
-
102
-
103
-
104
-
105
-
106
-
107
-
108
-
109
-
110
 |
 |

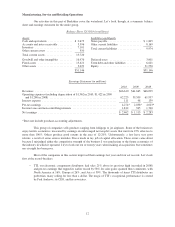
MidAmerican supplies 2.4 million customers in the U.S. with electricity, operating as the largest
supplier in Iowa, Wyoming and Utah and as an important provider in other states as well. Our pipelines transport
8% of the country’s natural gas. Obviously, many millions of Americans depend on us every day.
MidAmerican has delivered outstanding results for both its owners (Berkshire’s interest is 89.8%) and its
customers. Shortly after MidAmerican purchased Northern Natural Gas pipeline in 2002, that company’s
performance as a pipeline was rated dead last, 43 out of 43, by the leading authority in the field. In the most recent
report published, Northern Natural was ranked second. The top spot was held by our other pipeline, Kern River.
In its electric business, MidAmerican has a comparable record. Iowa rates have not increased since we
purchased our operation there in 1999. During the same period, the other major electric utility in the state has
raised prices more than 70% and now has rates far above ours. In certain metropolitan areas in which the two
utilities operate side by side, electric bills of our customers run far below those of their neighbors. I am told that
comparable houses sell at higher prices in these cities if they are located in our service area.
MidAmerican will have 2,909 megawatts of wind generation in operation by the end of 2011, more
than any other regulated electric utility in the country. The total amount that MidAmerican has invested or
committed to wind is a staggering $5.4 billion. We can make this sort of investment because MidAmerican
retains all of its earnings, unlike other utilities that generally pay out most of what they earn.
As you can tell by now, I am proud of what has been accomplished for our society by Matt Rose at
BNSF and by David Sokol and Greg Abel at MidAmerican. I am also both proud and grateful for what they have
accomplished for Berkshire shareholders. Below are the relevant figures:
MidAmerican Earnings (in millions)
2010 2009
U.K. utilities ............................................................ $ 333 $ 248
Iowa utility ............................................................. 279 285
Western utilities ......................................................... 783 788
Pipelines ............................................................... 378 457
HomeServices ........................................................... 42 43
Other (net) .............................................................. 47 25
Operating earnings before corporate interest and taxes ........................... 1,862 1,846
Interest, other than to Berkshire ............................................. (323) (318)
Interest on Berkshire junior debt ............................................. (30) (58)
Income tax .............................................................. (271) (313)
Net earnings ............................................................. $1,238 $1,157
Earnings applicable to Berkshire* ........................................... $1,131 $1,071
*Includes interest earned by Berkshire (net of related income taxes) of $19 in 2010 and $38 in 2009.
BNSF
(Historical accounting through 2/12/10; purchase accounting subsequently) (in millions)
2010 2009
Revenues ............................................................... $16,850 $14,016
Operating earnings ....................................................... 4,495 3,254
Interest (Net) ............................................................ 507 613
Pre-Tax earnings ......................................................... 3,988 2,641
Net earnings ............................................................. 2,459 1,721
15