Berkshire Hathaway 2010 Annual Report Download - page 68
Download and view the complete annual report
Please find page 68 of the 2010 Berkshire Hathaway annual report below. You can navigate through the pages in the report by either clicking on the pages listed below, or by using the keyword search tool below to find specific information within the annual report.-
 1
1 -
2
-
3
-
4
-
5
-
6
-
7
-
8
-
9
-
10
-
11
-
12
-
13
-
14
-
15
-
16
-
17
-
18
-
19
-
20
-
21
-
22
-
23
-
24
-
25
-
26
-
27
-
28
-
29
-
30
-
31
-
32
-
33
-
34
-
35
-
36
-
37
-
38
-
39
-
40
-
41
-
42
-
43
-
44
-
45
-
46
-
47
-
48
-
49
-
50
-
51
-
52
-
53
-
54
-
55
-
56
-
57
-
 58
58 -
 59
59 -
 60
60 -
 61
61 -
 62
62 -
 63
63 -
 64
64 -
 65
65 -
 66
66 -
 67
67 -
 68
68 -
 69
69 -
 70
70 -
 71
71 -
 72
72 -
 73
73 -
 74
74 -
 75
75 -
 76
76 -
 77
77 -
 78
78 -
79
-
80
-
81
-
82
-
83
-
84
-
85
-
86
-
87
-
88
-
89
-
90
-
91
-
92
-
93
-
94
-
95
-
96
-
97
-
98
-
99
-
100
-
101
-
102
-
103
-
104
-
105
-
106
-
107
-
108
-
109
-
110
 |
 |

Notes to Consolidated Financial Statements (Continued)
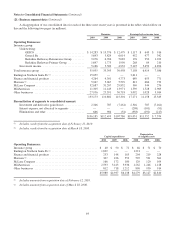
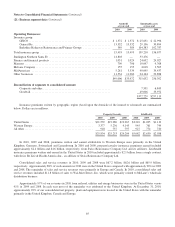
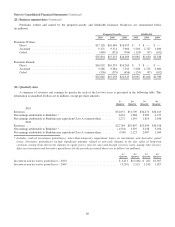
(21) Business segment data (Continued)
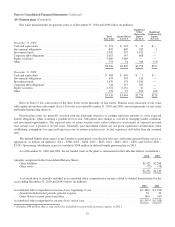
Premiums written and earned by the property/casualty and life/health insurance businesses are summarized below
(in millions).
Property/Casualty Life/Health
2010 2009 2008 2010 2009 2008
Premiums Written:
Direct .............................................. $17,128 $16,484 $16,953 $ 3 $ — $ —
Assumed ........................................... 9,171 9,321 7,960 5,203 2,727 2,690
Ceded .............................................. (465) (552) (704) (124) (97) (102)
$25,834 $25,253 $24,209 $5,082 $2,630 $2,588
Premiums Earned:
Direct .............................................. $16,932 $16,553 $16,269 $ 3 $ — $ —
Assumed ........................................... 9,266 9,284 7,332 5,208 2,723 2,682
Ceded .............................................. (536) (579) (656) (124) (97) (102)
$25,662 $25,258 $22,945 $5,087 $2,626 $2,580
(22) Quarterly data
A summary of revenues and earnings by quarter for each of the last two years is presented in the following table. This
information is unaudited. Dollars are in millions, except per share amounts.
1st
Quarter
2nd
Quarter
3rd
Quarter
4th
Quarter
2010
Revenues ............................................................. $32,037 $31,709 $36,274 $36,165
Net earnings attributable to Berkshire * ..................................... 3,633 1,968 2,989 4,377
Net earnings attributable to Berkshire per equivalent Class A common share ........ 2,272 1,195 1,814 2,656
2009
Revenues ............................................................. $22,784 $29,607 $29,904 $30,198
Net earnings attributable to Berkshire * ..................................... (1,534) 3,295 3,238 3,056
Net earnings attributable to Berkshire per equivalent Class A common share ........ (990) 2,123 2,087 1,969
*Includes realized investment gains/losses, other-than-temporary impairment losses on investments and derivative gains/
losses. Derivative gains/losses include significant amounts related to non-cash changes in the fair value of long-term
contracts arising from short-term changes in equity prices, interest rates and foreign currency rates, among other factors.
After-tax investment and derivative gains/losses for the periods presented above are as follows (in millions):
1st
Quarter
2nd
Quarter
3rd
Quarter
4th
Quarter
Investment and derivative gains/losses – 2010 .................................. $1,411 $(1,106) $ 202 $1,367
Investment and derivative gains/losses – 2009 .................................. (3,239) 1,515 1,183 1,027
66