Berkshire Hathaway 2008 Annual Report Download - page 88
Download and view the complete annual report
Please find page 88 of the 2008 Berkshire Hathaway annual report below. You can navigate through the pages in the report by either clicking on the pages listed below, or by using the keyword search tool below to find specific information within the annual report.-
 1
1 -
2
-
3
-
4
-
5
-
6
-
7
-
8
-
9
-
10
-
11
-
12
-
13
-
14
-
15
-
16
-
17
-
18
-
19
-
20
-
21
-
22
-
23
-
24
-
25
-
26
-
27
-
28
-
29
-
30
-
31
-
32
-
33
-
34
-
35
-
36
-
37
-
38
-
39
-
40
-
41
-
42
-
43
-
44
-
45
-
46
-
47
-
48
-
49
-
50
-
51
-
52
-
53
-
54
-
55
-
56
-
57
-
58
-
59
-
60
-
61
-
62
-
63
-
64
-
65
-
66
-
67
-
68
-
69
-
70
-
71
-
72
-
73
-
74
-
75
-
76
-
77
-
 78
78 -
 79
79 -
 80
80 -
 81
81 -
 82
82 -
 83
83 -
 84
84 -
 85
85 -
 86
86 -
 87
87 -
 88
88 -
 89
89 -
 90
90 -
 91
91 -
 92
92 -
 93
93 -
 94
94 -
 95
95 -
 96
96 -
 97
97 -
 98
98 -
99
-
100
 |
 |

Management’s Discussion (Continued)
Market Risk Disclosures
Berkshire’s Consolidated Balance Sheets include a substantial amount of assets and liabilities whose fair values are subject
to market risks. Berkshire’s significant market risks are primarily associated with interest rates, equity prices, foreign currency
exchange rates and commodity prices. During the fourth quarter of 2008, conditions in the public debt and equity markets
declined significantly resulting in exceptional volatility in debt and equity prices. The impact of actions taken recently by
governmental bodies in response to the current economic crisis is difficult to predict, particularly over the short term. Berkshire
management believes that these extraordinary conditions are temporary and that equity prices will ultimately rise over time and
that credit markets will normalize but cannot predict the timing or magnitude of a recovery. The fair values of Berkshire’s
investment portfolios and its equity index put option contracts remain subject to considerable volatility, particularly over the
short term. The following sections address the significant market risks associated with Berkshire’s business activities.
Interest Rate Risk
Berkshire’s regularly invests in bonds, loans or other interest rate sensitive instruments. Berkshire’s strategy is to acquire
securities that are attractively priced in relation to the perceived credit risk. Management recognizes and accepts that losses may
occur with respect to assets. Berkshire strives to maintain high credit ratings so that the cost of debt is minimized. Berkshire
utilizes derivative products, such as interest rate swaps, to manage interest rate risks on a limited basis.
The fair values of Berkshire’s fixed maturity investments and notes payable and other borrowings will fluctuate in response
to changes in market interest rates. Increases and decreases in prevailing interest rates generally translate into decreases and
increases in fair values of those instruments. Additionally, fair values of interest rate sensitive instruments may be affected by
the creditworthiness of the issuer, prepayment options, relative values of alternative investments, the liquidity of the instrument
and other general market conditions. The fair values of fixed interest rate investments may be more sensitive to interest rate
changes than variable rate investments.
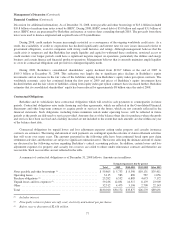
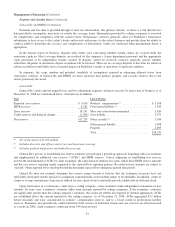
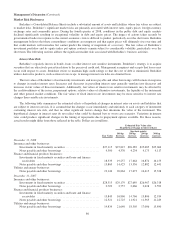
The following table summarizes the estimated effects of hypothetical changes in interest rates on assets and liabilities that
are subject to interest rate risk. It is assumed that the changes occur immediately and uniformly to each category of instrument
containing interest rate risk, and that no other significant factors change that determine the value of the instrument. The
hypothetical changes in interest rates do not reflect what could be deemed best or worst case scenarios. Variations in interest
rates could produce significant changes in the timing of repayments due to prepayment options available. For these reasons,
actual results might differ from those reflected in the table. Dollars are in millions.
Estimated Fair Value after
Hypothetical Change in Interest Rates
(bp=basis points)
100 bp 100 bp 200 bp 300 bp
Fair Value decrease increase increase increase
December 31, 2008
Insurance and other businesses:
Investments in fixed maturity securities ........................ $27,115 $27,847 $26,382 $25,685 $25,064
Notes payable and other borrowings .......................... 4,300 4,370 4,234 4,173 4,117
Finance and financial products businesses:
Investments in fixed maturity securities and loans and finance
receivables ............................................ 18,533 19,257 17,664 16,874 16,155
Notes payable and other borrowings .......................... 13,869 14,425 13,356 12,882 12,441
Utilities and energy businesses:
Notes payable and other borrowings .......................... 19,144 20,864 17,673 16,415 15,328
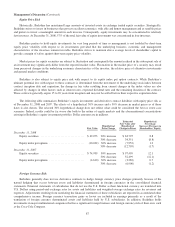
December 31, 2007
Insurance and other businesses:
Investments in fixed maturity securities ........................ $28,515 $29,179 $27,689 $26,967 $26,318
Notes payable and other borrowings .......................... 2,709 2,757 2,666 2,628 2,593
Finance and financial products businesses:
Investments in fixed maturity securities and loans and finance
receivables ............................................ 15,843 16,860 14,766 13,806 12,934
Notes payable and other borrowings .......................... 12,321 12,725 11,921 11,563 11,229
Utilities and energy businesses:
Notes payable and other borrowings .......................... 19,834 21,640 18,305 17,006 15,890
86