Berkshire Hathaway 2008 Annual Report Download - page 7
Download and view the complete annual report
Please find page 7 of the 2008 Berkshire Hathaway annual report below. You can navigate through the pages in the report by either clicking on the pages listed below, or by using the keyword search tool below to find specific information within the annual report.-
 1
1 -
 2
2 -
 3
3 -
 4
4 -
 5
5 -
 6
6 -
 7
7 -
 8
8 -
 9
9 -
 10
10 -
 11
11 -
 12
12 -
 13
13 -
 14
14 -
 15
15 -
 16
16 -
 17
17 -
 18
18 -
19
-
20
-
21
-
22
-
23
-
24
-
25
-
26
-
27
-
28
-
29
-
30
-
31
-
32
-
33
-
34
-
35
-
36
-
37
-
38
-
39
-
40
-
41
-
42
-
43
-
44
-
45
-
46
-
47
-
48
-
49
-
50
-
51
-
52
-
53
-
54
-
55
-
56
-
57
-
58
-
59
-
60
-
61
-
62
-
63
-
64
-
65
-
66
-
67
-
68
-
69
-
70
-
71
-
72
-
73
-
74
-
75
-
76
-
77
-
78
-
79
-
80
-
81
-
82
-
83
-
84
-
85
-
86
-
87
-
88
-
89
-
90
-
91
-
92
-
93
-
94
-
95
-
96
-
97
-
98
-
99
-
100
 |
 |
Things also went well on the capital-allocation front last year. Berkshire is always a buyer of both
businesses and securities, and the disarray in markets gave us a tailwind in our purchases. When investing,
pessimism is your friend, euphoria the enemy.
In our insurance portfolios, we made three large investments on terms that would be unavailable in
normal markets. These should add about $1
1
⁄
2
billion pre-tax to Berkshire’s annual earnings and offer
possibilities for capital gains as well. We also closed on our Marmon acquisition (we own 64% of the company
now and will purchase its remaining stock over the next six years). Additionally, certain of our subsidiaries made
“tuck-in” acquisitions that will strengthen their competitive positions and earnings.
That’s the good news. But there’s another less pleasant reality: During 2008 I did some dumb things in
investments. I made at least one major mistake of commission and several lesser ones that also hurt. I will tell
you more about these later. Furthermore, I made some errors of omission, sucking my thumb when new facts
came in that should have caused me to re-examine my thinking and promptly take action.
Additionally, the market value of the bonds and stocks that we continue to hold suffered a significant
decline along with the general market. This does not bother Charlie and me. Indeed, we enjoy such price declines
if we have funds available to increase our positions. Long ago, Ben Graham taught me that “Price is what you
pay; value is what you get.” Whether we’re talking about socks or stocks, I like buying quality merchandise
when it is marked down.
Yardsticks
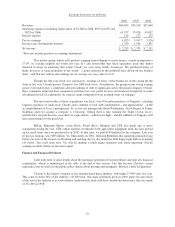
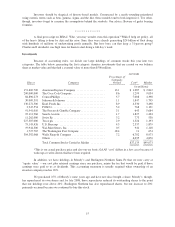
Berkshire has two major areas of value. The first is our investments: stocks, bonds and cash
equivalents. At yearend those totaled $122 billion (not counting the investments held by our finance and utility
operations, which we assign to our second bucket of value). About $58.5 billion of that total is funded by our
insurance float.
Berkshire’s second component of value is earnings that come from sources other than investments and
insurance. These earnings are delivered by our 67 non-insurance companies, itemized on page 96. We exclude
our insurance earnings from this calculation because the value of our insurance operation comes from the
investable funds it generates, and we have already included this factor in our first bucket.
In 2008, our investments fell from $90,343 per share of Berkshire (after minority interest) to $77,793, a
decrease that was caused by a decline in market prices, not by net sales of stocks or bonds. Our second segment
of value fell from pre-tax earnings of $4,093 per Berkshire share to $3,921 (again after minority interest).
Both of these performances are unsatisfactory. Over time, we need to make decent gains in each area if
we are to increase Berkshire’s intrinsic value at an acceptable rate. Going forward, however, our focus will be on
the earnings segment, just as it has been for several decades. We like buying underpriced securities, but we like
buying fairly-priced operating businesses even more.
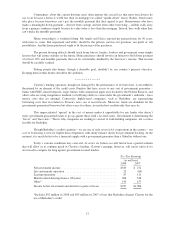
Now, let’s take a look at the four major operating sectors of Berkshire. Each of these has vastly
different balance sheet and income account characteristics. Therefore, lumping them together, as is done in
standard financial statements, impedes analysis. So we’ll present them as four separate businesses, which is how
Charlie and I view them.
5