Berkshire Hathaway 2008 Annual Report Download - page 85
Download and view the complete annual report
Please find page 85 of the 2008 Berkshire Hathaway annual report below. You can navigate through the pages in the report by either clicking on the pages listed below, or by using the keyword search tool below to find specific information within the annual report.-
 1
1 -
2
-
3
-
4
-
5
-
6
-
7
-
8
-
9
-
10
-
11
-
12
-
13
-
14
-
15
-
16
-
17
-
18
-
19
-
20
-
21
-
22
-
23
-
24
-
25
-
26
-
27
-
28
-
29
-
30
-
31
-
32
-
33
-
34
-
35
-
36
-
37
-
38
-
39
-
40
-
41
-
42
-
43
-
44
-
45
-
46
-
47
-
48
-
49
-
50
-
51
-
52
-
53
-
54
-
55
-
56
-
57
-
58
-
59
-
60
-
61
-
62
-
63
-
64
-
65
-
66
-
67
-
68
-
69
-
70
-
71
-
72
-
73
-
74
-
 75
75 -
 76
76 -
 77
77 -
 78
78 -
 79
79 -
 80
80 -
 81
81 -
 82
82 -
 83
83 -
 84
84 -
 85
85 -
 86
86 -
 87
87 -
 88
88 -
 89
89 -
 90
90 -
 91
91 -
 92
92 -
 93
93 -
 94
94 -
 95
95 -
96
-
97
-
98
-
99
-
100
 |
 |

Management’s Discussion (Continued)
Property and casualty losses (Continued)
General Re (Continued)
Property losses were lower than expected in 2008 but the nature of property loss experience tends to be more volatile
because of the effect of catastrophes and large individual property losses. In response to favorable claim developments and
another year of information, estimated remaining World Trade Center losses were reduced by $25 million.
In certain reserve cells within excess directors and officers and errors and omissions (“D&O and E&O”) coverages, IBNR
reserves are based on estimated ultimate losses without consideration of expected emergence patterns. These cells often involve
a spike in loss activity arising from recent industry developments making it difficult to select an expected loss emergence
pattern. For General Re’s large D&O and E&O reserve cells an increase of ten points in the tail of the expected emergence
pattern (for those cells where emergence patterns are considered) and an increase of ten percent in the expected loss ratios
would produce a net increase in nominal IBNR reserves and a corresponding reduction in pre-tax earnings of approximately
$250 million. Management believes it is reasonably possible for the tail of the expected loss emergence patterns and expected
loss ratios to increase at these rates.
Overall industry-wide loss experience data and informed judgment are used when internal loss data is of limited reliability,
such as in setting the estimates for mass tort, asbestos and hazardous waste (collectively, “mass tort”) claims. Unpaid mass tort
reserves at December 31, 2008 were approximately $1.8 billion gross and $1.2 billion net of reinsurance. Such reserves were
approximately $1.8 billion gross and $1.2 billion net of reinsurance as of December 31, 2007. Mass tort net claims paid were
about $69 million in 2008. In 2008, ultimate loss estimates for asbestos and environmental claims were increased by $45
million. In addition to the previously described methodologies, General Re considers “survival ratios” based on net claim
payments in recent years versus net unpaid losses as a rough guide to reserve adequacy. The three year survival ratio was
approximately fourteen years as of December 31, 2008. The insurance industry’s comparable survival ratio for asbestos and
pollution reserves was approximately nine years. Estimating mass tort losses is very difficult due to the changing legal
environment. Although such reserves are believed to be adequate, significant reserve increases may be required in the future if
new exposures or claimants are identified, new claims are reported or new theories of liability emerge.
BHRG
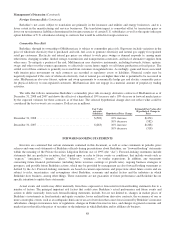
BHRG’s unpaid losses and loss adjustment expenses as of December 31, 2008 are summarized as follows. Amounts are in
millions.
Property Casualty Total
Reported case reserves ........................................................... $1,836 $ 2,426 $ 4,262
IBNR reserves .................................................................. 1,821 3,466 5,287
Retroactive .................................................................... — 16,630 16,630
Gross reserves .................................................................. $3,657 $22,522 26,179
Deferred charges and ceded reserves ................................................ (4,793)
Net reserves .................................................................... $21,386
In general, the methodologies used to establish loss reserves vary widely and encompass many of the common
methodologies employed in the actuarial field today. Certain traditional methodologies such as paid and incurred loss
development techniques, incurred and paid loss Bornhuetter-Ferguson techniques and frequency and severity techniques are
utilized as well as ground-up techniques where appropriate. Additional judgments must also be employed to consider changes in
contract conditions and terms as well as the incidence of litigation or legal and regulatory change.
As of December 31, 2008, BHRG’s gross loss reserves related to retroactive reinsurance policies were predominantly
casualty losses. Retroactive policies include excess-of-loss contracts, in which losses (relating to loss events occurring before a
specified date on or before the contract date) above a contractual retention are indemnified or contracts that indemnify all losses
paid by the counterparty after the policy effective date. Retroactive reinsurance losses and loss adjustment expenses paid in
2008 were $1.2 billion. The classification “reported case reserves” has no practical analytical value with respect to retroactive
policies since the amount is often derived from reports in bulk from ceding companies, who may have inconsistent definitions of
“case reserves.” Reserves are reviewed and established in the aggregate by contract including provisions for IBNR reserves.
83