Berkshire Hathaway 2008 Annual Report Download - page 42
Download and view the complete annual report
Please find page 42 of the 2008 Berkshire Hathaway annual report below. You can navigate through the pages in the report by either clicking on the pages listed below, or by using the keyword search tool below to find specific information within the annual report.-
 1
1 -
2
-
3
-
4
-
5
-
6
-
7
-
8
-
9
-
10
-
11
-
12
-
13
-
14
-
15
-
16
-
17
-
18
-
19
-
20
-
21
-
22
-
23
-
24
-
25
-
26
-
27
-
28
-
29
-
30
-
31
-
 32
32 -
 33
33 -
 34
34 -
 35
35 -
 36
36 -
 37
37 -
 38
38 -
 39
39 -
 40
40 -
 41
41 -
 42
42 -
 43
43 -
 44
44 -
 45
45 -
 46
46 -
 47
47 -
 48
48 -
 49
49 -
 50
50 -
 51
51 -
 52
52 -
53
-
54
-
55
-
56
-
57
-
58
-
59
-
60
-
61
-
62
-
63
-
64
-
65
-
66
-
67
-
68
-
69
-
70
-
71
-
72
-
73
-
74
-
75
-
76
-
77
-
78
-
79
-
80
-
81
-
82
-
83
-
84
-
85
-
86
-
87
-
88
-
89
-
90
-
91
-
92
-
93
-
94
-
95
-
96
-
97
-
98
-
99
-
100
 |
 |

Notes to Consolidated Financial Statements (Continued)
(5) Other Investments (Continued)
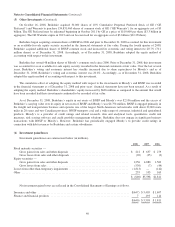
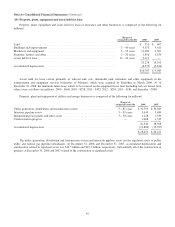
On October 16, 2008, Berkshire acquired 30,000 shares of 10% Cumulative Perpetual Preferred Stock of GE (“GE
Preferred”) and Warrants to purchase 134,831,460 shares of common stock of GE (“GE Warrants”) for an aggregate cost of $3
billion. The GE Preferred may be redeemed beginning in October 2011 by GE at a price of $110,000 per share ($3.3 billion in
aggregate). The GE Warrants expire in 2013 and can be exercised for an aggregate cost of $3 billion ($22.25/share).
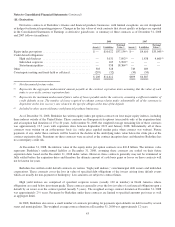
Berkshire began acquiring common shares of BNSF in 2006 and prior to December 31, 2008 accounted for this investment
as an available-for-sale equity security recorded in the financial statements at fair value. During the fourth quarter of 2008,
Berkshire acquired additional shares of BNSF common stock and increased its economic and voting interest to 20.7% (70.1
million shares) as of December 31, 2008. Accordingly, as of December 31, 2008, Berkshire adopted the equity method of
accounting with respect to this investment.
Berkshire has owned 48 million shares of Moody’s common stock since 2000. Prior to December 31, 2008, this investment
was accounted for as an available-for-sale equity security recorded in the financial statements at fair value. Over the last several
years, Berkshire’s voting and economic interest has steadily increased due to share repurchases by Moody’s and as of
December 31, 2008, Berkshire’s voting and economic interest was 20.4%. Accordingly, as of December 31, 2008, Berkshire
adopted the equity method of accounting with respect to this investment.
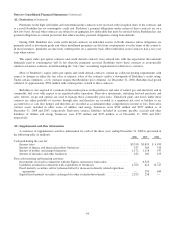
The cumulative effect of adopting the equity method with respect to the investments in Moody’s and BNSF was recorded
in the financial statements as of December 31, 2008 and prior years’ financial statements have not been restated. As a result of
adopting the equity method, Berkshire’s shareholders’ equity increased by $626 million as compared to the amount that would
have been recorded had these investments continued to be recorded at fair value.
As of December 31, 2008, Berkshire’s equity in net assets of BNSF and Moody’s was $2,106 million and the excess of
Berkshire’s carrying value over its equity in net assets of BNSF and Moody’s was $4,754 million. BNSF is engaged primarily in
the freight rail transportation business and operates one of the largest North American rail networks with about 32,000 route
miles in 28 states and two Canadian provinces. BNSF transports coal and a wide range of consumer, industrial and agricultural
products. Moody’s is a provider of credit ratings and related research, data and analytical tools, quantitative credit risk
measures, risk scoring software and credit portfolio management solutions. Berkshire does not engage in significant business
transactions with BNSF or Moody’s. However, Berkshire has periodically engaged Moody’s to provide credit ratings in
connection with debt issuances by Berkshire and certain subsidiaries.
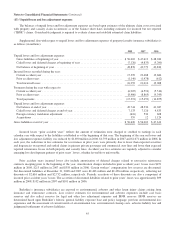
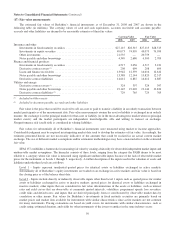
(6) Investment gains/losses
Investment gains/losses are summarized below (in millions).
2008 2007 2006
Fixed maturity securities —
Gross gains from sales and other disposals ......................................... $ 212 $ 657 $ 279
Gross losses from sales and other disposals ......................................... (20) (35) (9)
Equity securities —
Gross gains from sales and other disposals ......................................... 1,256 4,880 1,562
Gross losses from sales ......................................................... (530) (7) (44)
Losses from other-than-temporary impairments .......................................... (1,813) — (142)
Other ........................................................................... 255 103 165
$ (640) $5,598 $1,811
Net investment gains/losses are reflected in the Consolidated Statements of Earnings as follows.
Insurance and other ................................................................ $(647) $ 5,405 $ 1,697
Finance and financial products ....................................................... 7 193 114
$(640) $ 5,598 $ 1,811
40