Berkshire Hathaway 2008 Annual Report Download - page 62
Download and view the complete annual report
Please find page 62 of the 2008 Berkshire Hathaway annual report below. You can navigate through the pages in the report by either clicking on the pages listed below, or by using the keyword search tool below to find specific information within the annual report.-
 1
1 -
2
-
3
-
4
-
5
-
6
-
7
-
8
-
9
-
10
-
11
-
12
-
13
-
14
-
15
-
16
-
17
-
18
-
19
-
20
-
21
-
22
-
23
-
24
-
25
-
26
-
27
-
28
-
29
-
30
-
31
-
32
-
33
-
34
-
35
-
36
-
37
-
38
-
39
-
40
-
41
-
42
-
43
-
44
-
45
-
46
-
47
-
48
-
49
-
50
-
51
-
 52
52 -
 53
53 -
 54
54 -
 55
55 -
 56
56 -
 57
57 -
 58
58 -
 59
59 -
 60
60 -
 61
61 -
 62
62 -
 63
63 -
 64
64 -
 65
65 -
 66
66 -
 67
67 -
 68
68 -
 69
69 -
 70
70 -
 71
71 -
 72
72 -
73
-
74
-
75
-
76
-
77
-
78
-
79
-
80
-
81
-
82
-
83
-
84
-
85
-
86
-
87
-
88
-
89
-
90
-
91
-
92
-
93
-
94
-
95
-
96
-
97
-
98
-
99
-
100
 |
 |

Notes to Consolidated Financial Statements (Continued)
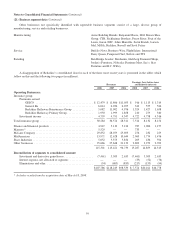
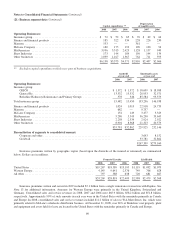
(21) Business segment data (Continued)
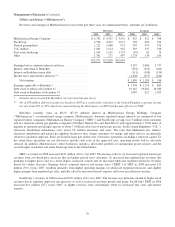
Capital expenditures **
Depreciation
of tangible assets
2008 2007 2006 2008 2007 2006
Operating Businesses:
Insurance group ............................................. $ 72 $ 52 $ 65 $ 70 $ 69 $ 64
Finance and financial products ................................. 185 322 334 228 226 230
Marmon ................................................... 553 — — 361 — —
McLane Company ........................................... 180 175 193 109 100 94
MidAmerican .............................................. 3,936 3,513 2,423 1,128 1,157 949
Shaw Industries ............................................. 173 144 189 150 144 134
Other businesses ............................................ 1,039 1,167 1,367 764 711 595
$6,138 $5,373 $4,571 $2,810 $2,407 $2,066
** Excludes capital expenditures which were part of business acquisitions.
Goodwill
at year-end
Identifiable assets
at year-end
2008 2007 2008 2007
Operating Businesses:
Insurance group:
GEICO ......................................................... $ 1,372 $ 1,372 $ 18,699 $ 18,988
General Re ...................................................... 13,532 13,532 28,953 32,571
Berkshire Hathaway Reinsurance and Primary Groups ................... 578 546 85,584 95,379
Total insurance group ................................................. 15,482 15,450 133,236 146,938
Finance and financial products .......................................... 1,024 1,013 22,918 24,733
Marmon ............................................................ 682 — 9,757 —
McLane Company .................................................... 154 149 3,477 3,329
MidAmerican ....................................................... 5,280 5,543 36,290 33,645
Shaw Industries ...................................................... 2,258 2,339 2,924 2,922
Other businesses ..................................................... 8,901 8,368 21,323 20,579
$33,781 $32,862 229,925 232,146
Reconciliation of segments to consolidated amount:
Corporate and other ............................................... 3,693 8,152
Goodwill ....................................................... 33,781 32,862
$267,399 $273,160
Insurance premiums written by geographic region (based upon the domicile of the insured or reinsured) are summarized
below. Dollars are in millions.
Property/Casualty Life/Health
2008 2007 2006 2008 2007 2006
United States ............................................ $19,267 $18,589 $19,195 $1,119 $1,092 $1,073
Western Europe .......................................... 4,145 9,641 2,576 749 706 628
All other ................................................ 797 588 638 720 681 667
$24,209 $28,818 $22,409 $2,588 $2,479 $2,368
Insurance premiums written and earned in 2007 included $7.1 billion from a single reinsurance transaction with Equitas. See
Note 13 for additional information. Amounts for Western Europe were primarily in the United Kingdom, Switzerland and
Germany. Consolidated sales and service revenues in 2008, 2007 and 2006 were $65.9 billion, $58.2 billion and $51.8 billion,
respectively. Approximately 90% of such amounts in each year were in the United States with the remainder primarily in Canada
and Europe. In 2008, consolidated sales and service revenues included $11.2 billion of sales to Wal-Mart Stores, Inc. which were
primarily related to McLane’s wholesale distribution business. At December 31, 2008, over 80% of Berkshire’s net property, plant
and equipment and assets held for lease are located in the United States with the remainder primarily in Canada and Europe.
60