Berkshire Hathaway 2008 Annual Report Download - page 71
Download and view the complete annual report
Please find page 71 of the 2008 Berkshire Hathaway annual report below. You can navigate through the pages in the report by either clicking on the pages listed below, or by using the keyword search tool below to find specific information within the annual report.-
 1
1 -
2
-
3
-
4
-
5
-
6
-
7
-
8
-
9
-
10
-
11
-
12
-
13
-
14
-
15
-
16
-
17
-
18
-
19
-
20
-
21
-
22
-
23
-
24
-
25
-
26
-
27
-
28
-
29
-
30
-
31
-
32
-
33
-
34
-
35
-
36
-
37
-
38
-
39
-
40
-
41
-
42
-
43
-
44
-
45
-
46
-
47
-
48
-
49
-
50
-
51
-
52
-
53
-
54
-
55
-
56
-
57
-
58
-
59
-
60
-
 61
61 -
 62
62 -
 63
63 -
 64
64 -
 65
65 -
 66
66 -
 67
67 -
 68
68 -
 69
69 -
 70
70 -
 71
71 -
 72
72 -
 73
73 -
 74
74 -
 75
75 -
 76
76 -
 77
77 -
 78
78 -
 79
79 -
 80
80 -
 81
81 -
82
-
83
-
84
-
85
-
86
-
87
-
88
-
89
-
90
-
91
-
92
-
93
-
94
-
95
-
96
-
97
-
98
-
99
-
100
 |
 |

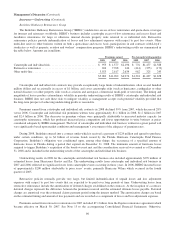
Management’s Discussion (Continued)
Insurance—Investment Income (Continued)
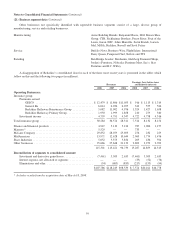
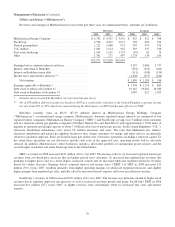
A summary of investments held in Berkshire’s insurance businesses follows. Amounts are in millions.
2008 2007 2006
Cash and cash equivalents ..................................................... $ 18,845 $ 28,257 $ 34,590
Equity securities ............................................................. 48,892 74,681* 61,168*
Fixed maturity securities ...................................................... 26,932 27,922 25,272
Other ...................................................................... 21,535* — —
$116,204 $130,860 $121,030
*Other investments include the investments in Wrigley, Goldman Sachs and General Electric as well as investments in
Burlington Northern and Moody’s, which as of December 31, 2008 are accounted for under the equity method. In 2007 and
2006, investments in Burlington Northern and Moody’s are included in equity securities.
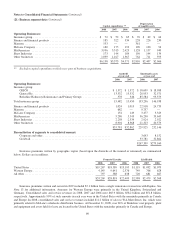
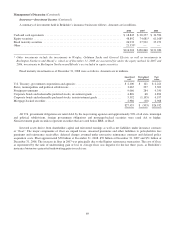
Fixed maturity investments as of December 31, 2008 were as follows. Amounts are in millions.
Amortized
cost
Unrealized
gains/losses
Fair
value
U.S. Treasury, government corporations and agencies ................................ $ 2,100 $ 121 $ 2,221
States, municipalities and political subdivisions ..................................... 3,065 237 3,302
Foreign governments .......................................................... 9,066 284 9,350
Corporate bonds and redeemable preferred stocks, investment grade .................... 4,826 68 4,894
Corporate bonds and redeemable preferred stocks, non-investment grade ................. 5,392 (1,195) 4,197
Mortgage-backed securities ..................................................... 2,986 (18) 2,968
$27,435 $ (503) $26,932
All U.S. government obligations are rated AAA by the major rating agencies and approximately 90% of all state, municipal
and political subdivisions, foreign government obligations and mortgage-backed securities were rated AA or higher.
Non-investment grade securities represent securities that are rated below BBB- or Baa3.
Invested assets derive from shareholder capital and reinvested earnings as well as net liabilities under insurance contracts
or “float.” The major components of float are unpaid losses, unearned premiums and other liabilities to policyholders less
premiums and reinsurance receivables, deferred charges assumed under retroactive reinsurance contracts and deferred policy
acquisition costs. Float approximated $58 billion at December 31, 2008, $59 billion at December 31, 2007 and $51 billion at
December 31, 2006. The increase in float in 2007 was principally due to the Equitas reinsurance transaction. The cost of float,
as represented by the ratio of underwriting gain or loss to average float, was negative for the last three years, as Berkshire’s
insurance businesses generated underwriting gains in each year.
69