Berkshire Hathaway 2008 Annual Report Download - page 40
Download and view the complete annual report
Please find page 40 of the 2008 Berkshire Hathaway annual report below. You can navigate through the pages in the report by either clicking on the pages listed below, or by using the keyword search tool below to find specific information within the annual report.-
 1
1 -
2
-
3
-
4
-
5
-
6
-
7
-
8
-
9
-
10
-
11
-
12
-
13
-
14
-
15
-
16
-
17
-
18
-
19
-
20
-
21
-
22
-
23
-
24
-
25
-
26
-
27
-
28
-
29
-
 30
30 -
 31
31 -
 32
32 -
 33
33 -
 34
34 -
 35
35 -
 36
36 -
 37
37 -
 38
38 -
 39
39 -
 40
40 -
 41
41 -
 42
42 -
 43
43 -
 44
44 -
 45
45 -
 46
46 -
 47
47 -
 48
48 -
 49
49 -
 50
50 -
51
-
52
-
53
-
54
-
55
-
56
-
57
-
58
-
59
-
60
-
61
-
62
-
63
-
64
-
65
-
66
-
67
-
68
-
69
-
70
-
71
-
72
-
73
-
74
-
75
-
76
-
77
-
78
-
79
-
80
-
81
-
82
-
83
-
84
-
85
-
86
-
87
-
88
-
89
-
90
-
91
-
92
-
93
-
94
-
95
-
96
-
97
-
98
-
99
-
100
 |
 |

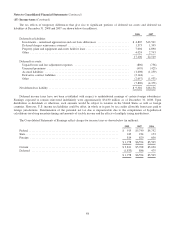
Notes to Consolidated Financial Statements (Continued)
(2) Significant business acquisitions (Continued)
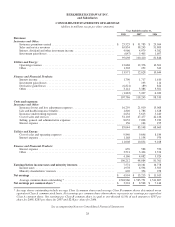
The results of operations for each of these businesses are included in Berkshire’s consolidated results from the effective
date of each acquisition. The following table sets forth certain unaudited pro forma consolidated earnings data for 2008 and
2007, as if each acquisition occurring during 2008 and 2007 was consummated on the same terms at the beginning of each year.
Amounts are in millions, except earnings per share.
2008 2007
Total revenues .............................................................. $109,180 $125,904
Net earnings ................................................................ 5,098 13,326
Earnings per equivalent Class A common share .................................... 3,291 8,621
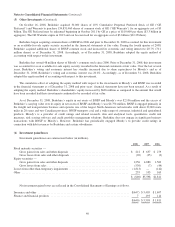
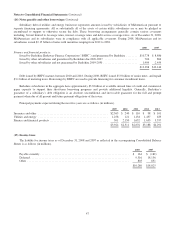
(3) Investments in fixed maturity securities
Investments in securities with fixed maturities as of December 31, 2008 and 2007 are shown below (in millions).
Amortized
Cost
Unrealized
Gains
Unrealized
Losses *
Fair
Value
2008
Insurance and other:
U.S. Treasury, U.S. government corporations and agencies ................... $ 2,100 $ 123 $ (2) $ 2,221
States, municipalities and political subdivisions ............................ 3,192 242 (5) 3,429
Foreign governments ................................................. 9,106 343 (59) 9,390
Corporate bonds and redeemable preferred stocks .......................... 10,230 373 (1,500) 9,103
Mortgage-backed securities ............................................ 2,990 70 (88) 2,972
$27,618 $1,151 $(1,654) $27,115
Finance and financial products:
U.S. Treasury, U.S. government corporations and agencies ................... $ 7 $ — $ — $ 7
States, municipalities and political subdivisions ............................ 1,312 — — 1,312
Corporate bonds ..................................................... 568 21 (68) 521
Mortgage-backed securities ............................................ 2,410 268 (1) 2,677
$ 4,297 $ 289 $ (69) $ 4,517
2007
Insurance and other:
U.S. Treasury, U.S. government corporations and agencies ................... $ 3,487 $ 59 $ — $ 3,546
States, municipalities and political subdivisions ............................ 2,120 107 (3) 2,224
Foreign governments ................................................. 9,529 76 (47) 9,558
Corporate bonds and redeemable preferred stocks .......................... 8,400 1,187 (48) 9,539
Mortgage-backed securities ............................................ 3,597 62 (11) 3,648
$27,133 $1,491 $ (109) $28,515
Finance and financial products:
Corporate bonds ..................................................... $ 420 $ 63 $ — $ 483
Mortgage-backed securities ............................................ 2,521 228 (1) 2,748
$ 2,941 $ 291 $ (1) $ 3,231
* Includes gross unrealized losses of $176 million at December 31, 2008 and $60 million at December 31, 2007 related to
securities that have been in an unrealized loss position for 12 months or more.
As of December 31, 2008, fixed maturity investments included approximately $2.7 billion (Insurance and other — $1.4
billion and Finance and financial products — $1.3 billion) of investment grade auction rate bonds and variable rate demand
notes issued by various municipalities and political subdivisions. The interest rates are periodically reset at up to 35 day
intervals. While substantially all of these securities are insured by third parties, acquisitions were limited to securities where
Berkshire concluded that the underlying credit of the issuers was good without the benefit of an insurer’s guarantee.
38